Volume: 24 Issue: 8 August 2026
FULL TEXT
Red Cell Distribution Width and Its Association With Inflammatory Burden and Proteinuria in Kidney Transplant Recipients
Objectives: This study aimed to investigate whether red cell distribution width can serve as an indicator of subclinical inflammation in kidney transplant recipients by examining its relationship with inflam-matory markers, renal functional parameters, bone mineral metabolism, and urinary protein excretion.
Materials and Methods: We retrospective examined 120 adult kidney transplant recipients followed at our center. We obtained demographic characteristics, immunosuppressive regimens, and laboratory values from hospital records. Biochemical measurements included complete blood count, blood urea nitrogen, serum creatinine, albumin, electrolytes, calcium, phosphorus, parathyroid hormone, 25-hydroxyvitamin D, glycosylated hemoglobin, high-sensitivity C-reactive protein, and urine protein-to-creatinine ratio. We categorized patients into 2 groups by mean value of red cell distribution width (<14.5 vs ≥14.5). We analyzed correlations between red cell distribution width and laboratory parameters using appropriate statistical methods. P < .05 was considered significant.
Results: Mean age of kidney transplant recipients was 40.9 years, and 52 were women. Overall mean red cell distribution width value was 14.5. Red cell distribution width showed significant positive correlations with parathyroid hormone (r = 0.305; P = .001), high-sensitivity C-reactive protein (r = 0.189, P = 0.037), and glycosylated hemoglobin (r = 0.192, P = .034) and a borderline correlation with urine protein-to-creatinine ratio (r = 0.177; P = .052). Patients with red cell distribution width ≥14.5 had higher parathyroid hormone, high-sensitivity C-reactive protein, and urine protein-to-creatinine ratio values and lower 25-hydroxyvitamin D levels compared with those with red cell distribution width <14.5 (all P < .01).
Conclusions: Increased red cell distribution width values in stable kidney transplant recipients were associated with increased inflammatory markers, greater proteinuria, and alterations in bone mineral metabolism. Red cell distribution width may serve as an accessible indicator of subclinical inflammation and metabolic dysfunction in this population; however, prospective studies are needed to confirm findings.
Key words : Biomarker, Kidney transplantation, Parathyroid hormone, Subclinical inflammation, Vitamin D deficiency
Introduction
Proteinuria is an important prognostic factor for both chronic kidney disease and kidney transplant recipients (KTRs) in terms of renal damage. The degree of proteinuria causes graft loss in the transplanted kidney and affects the rate of progression to end-stage renal disease. Proteinuria has been shown to be associated with inflammation, oxidative stress, neuro-humoral activation, and endothelial dysfunction. Red Cell distribution width (RDW), which is an objective indicator of anisocytosis, is also known to be associated with these factors. The relationship between RDW level and proteinuria has been examined in a few studies. However, the relation of RDW level with proteinuria, if there is, has not been sufficiently clarified.
Red Cell distribution width, which shows the distribution width of the sizes of circulating erythrocytes, is calculated by multiplying the ratio of the standard deviation of the erythrocyte volume to the mean erythrocyte volume by 100.1 The result may be significant if RDW is normal or increased. When within normal limits, RDW indicates that the size of erythrocytes is in a regular distribution. High RDW usually occurs as a result of increased erythrocyte destruction (hemolysis), nutritional deficiency (iron, vitamin B12, and folic acid deficiency), or blood transfusion.2 Red Celldistribution width is not only used in the differentiation of anemia types but also has been shown to predict poor prognosis in many serious diseases such as coronary artery disease, stroke, peripheral artery disease, heart failure, venous thromboembolism, and pulmonary arterial hypertension.3-10 High RDW is seen as a result of chronic inflammation and ineffective erythropoiesis due to neurohumoral activation.
During inflammation, inflammatory cytokines suppress erythrocyte maturation and increase erythrocyte heterogeneity by causing juvenile erythrocyte entry into the circulation.11-13 In their study, Afonso and colleagues observed an inde-pendent relationship between high RDW and high microalbuminuria.14 The investigators suggested that the interaction between chronic inflammation, oxi-dative stress, neurohumoral overactivity, and endot-helial dysfunction may explain this relationship and increased cardiovascular/renal risk.14
In this study, we aimed to determine whether RDW levels can be used as a predictor of inflam-mation by examining the relationship between RDW value and inflammation, renal function, and vitamin D in KTRs.
Materials and Method
We included 120 adult KTRs followed in our Nephrology Unit Transplantation Outpatient Clinic. We retrospectively analyzed medical records of the included KTRs.
Inclusion criteria included KTRs aged 18 to 70 years, patients with stable kidney function (no change in serum creatinine value of more than 10% in the past 3 months), patients with no acute rejection attack in the past year, patients with no change in immunosuppressive drug or doses in the past month, and patients with well-controlled blood pressure. All patients gave consent for study.
Demographic and clinical characteristics and laboratory values of the patients were obtained from the medical records. We obtained demographic and clinical characteristics, including patient age, sex, transplant age, duration of transplant, type of donor (living or deceased), etiology of kidney disease, immunosuppressive drugs and their doses, presence of hypertension, antihypertensive drugs, office blood pressure measurements, height and body weight, and body mass index.
From routine blood samples, we also obtained values of serum blood urea nitrogen, creatinine, albumin, cholesterol, high- and low-density lipo-protein, triglyceride, uric acid, calcium, phosphorus, hemoglobin, hematocrit, platelet count, RDW, 25-hydroxyvitamin D3, aspartate aminotransferase, and alanine aminotransferase. We also recorded hemog-lobin A1c (HbA1c), parathyroid hormone (PTH) levels, urine protein-to-creatinine ratios (UPCRs), and high-sensitivity C-reactive protein (hsCRP) levels from medical records. Volume of urine sample was calculated first, and then protein, albumin, creatinine, and sodium levels were calculated. Urine protein-to-creatinine ratio (in mg/g) was used to calculate daily protein excretion, and urine albumin-to-urine creatinine ratio (in mg/g) was used for to calculate daily excretion of albumin.
Routine biochemical parameters were determined in the Roche Hitachi Modular analyzer system according to manufacturer’s instructions (Roche Diagnostics). Complete blood count parameters were measured in Beckman Coulter whole blood counter according to manufacturer’s instructions. Creatinine was studied according to the compensated Jaffe method. The creatinine method has been standardized by isotope dilution-mass spectrometry. Albumin was measured calorimetrically by the bromocresol green method. Cholesterol was measured enzymatically and calorimetrically by the cholesterol oxidase method. High-density lipoprotein was measured enzymatically and calorimetrically using polyethylene glycol-modified enzyme. Low-density lipoprotein was measured by selective detergent. Cholesterol esterase/cholesterol oxidase and homogenization were measured by the enzymatic calorimetric method. Uric acid, and uricase/peroxidase reactions were measured by photometry and HbA1c by the immunoturbidimetric method.
Statistical analyses
We categorized patients into 2 groups by mean value of RDW (<14.5 vs ≥14.5). We tested for normal distribution by using the Shapiro-Wilks test. We used the t test to compare normally distributed numerical variables in the 2 groups and the Mann Whitney U test to compare nonnormally distributed variables in the 2 groups. We tested for associations between normally distributed numerical variables with Pearson correlation coefficient and for associations between nonnormally distributed numerical variab-les with the Spearman rank correlation coefficient. We used SPSS version 22.0 for analyses. P < .05 was considered significant.
Ethics approval
The study was approved by the Clinical Research Ethics Committee of Gaziantep University (approval number 2018/34; January 18, 2018) and conducted in accordance with the Declaration of Helsinki.
Results
Demographic characteristics, drugs used, and labo-ratory values of KTRs are summarized in Table 1 and Table 2. The mean RDW index of KTRs was 14.5. Group 1 (RDW level <14.5) included 68 KTRs, and group 2 (RDW level ≥14.5) included 52 KTRs.
Average RDW index was 13.29 (range, 11.9-14.4) in group 1 and 15.8 (range, 14.5-23.1) in group 2 (P < .01) (Table 2, Figure 1). Significant differences were shown between groups 1 and 2 for UPCR, hsCRP, PTH, and 25-hydroxyvitamin D3 values (Table 2, Figure 2).
Among all KTRs, significant positive correlations were shown between RDW levels and PTH (r = 0.305, P < .01) (Figure 3), hsCRP (r = 0.189, P = .037)
(Figure 4), and HbA1C (r = 0.192, P = .034) (Figure 5). Although a positive correlation was shown between RDW levels and UPCR, this correlation did not reach statistical significance (r = 0.177, P = .052) (Figure 6).
In KTRs, no statistically significant correlation was shown between RDW levels and demographic parameters, duration since transplant, donor type (living or deceased), pretransplant treatment type (hemodialysis, peritoneal dialysis, preemptive), original kidney disease, hypertension, type and dosage of antihypertensive agents used, type and doses of drugs, systolic-diastolic blood pressure levels, and other laboratory parameters.
Discussion
The amount of protein excreted in the urine is a strong indicator of consequences that may arise in the follow-up of the transplanted kidney.15 Pro-teinuria alone creates inflammation and contributes to the progression of kidney diseases by increasing the production of angiotensin 2, chemokines, cytokines, and endothelin 1.15 All of these agonists stimulate interstitial fibroblasts and cause transfor-mation of epithelial cells into fibroblast cells16 Thus, it causes interstitial fibrosis.16
The kidney allograft is particularly vulnerable to side effects caused by proteinuria for several reasons. Protein-loaded epithelial cells express more MHC-2 antigens.17 This situation makes cells more easily damaged by immune reactions.17 Endothelin 1, which is expressed by proximal tubule cells of the kidney, is also a potent agonist for the development of renal fibrosis. When these facts are considered, the role of proteinuria in the pathogenesis of chronic allograft nephropathy and thus fibrosis is critical and requisite. Available evidence on proteinuria after kidney transplant suggests that microalbuminuria and, more importantly, proteinuria are valuable indicators of impaired graft function, pointing to graft loss and increased cardiovascular risks.18
High RDW is seen as a result of chronic inflam-mation and ineffective erythropoiesis due to neurohumoral activation. During inflammation, inflammatory cytokines suppress erythrocyte matu-ration and increase erythrocyte heterogeneity by causing juvenile erythrocyte entry into the circulation.11-13 Afonso and colleagues observed an independent relationship between high RDW and high microalbuminuria. They suggested that the interaction between chronic inflammation, oxidative stress, neurohumoral overactivity, and endothelial dysfunction may explain this relationship and increased cardiovascular/renal risk.14 Overstimu-lation of neurohumoral activity has been shown to suppress erythropoiesis and induce anemia inde-pendent of serum erythropoietin levels. Similarly, higher levels of neurohumoral activity were inde-pendently associated with a higher incidence of microalbuminuria. Therefore, sympathetic overactivity may also explain the relationship between high RDW and microalbuminuria and chronic inflammation.14
Red cell distribution width is influenced by multiple hematologic and inflammatory factors that should be considered when interpreting its clinical relevance in KTRs. Iron deficiency, functional iron deficiency associated with chronic inflammation, and anemia of chronic disease are well-known contributors to increased RDW. In addition, erythropoietin use, which is common in this population, may alter erythrocyte maturation dynamics and contribute to RDW variability.
Beyond classical hematologic mechanisms, KTRs are exposed to persistent low-grade inflammation, immune activation, and metabolic effects of long-term immunosuppressive therapy. Calcineurin inhi-bitors and corticosteroids may indirectly affect erythropoiesis through inflammatory pathways, oxidative stress, and renal function fluctuations. Therefore, RDW in this setting likely reflects the cumulative burden of several interrelated patho-physiological processes rather than a single isolated mechanism.
Although a positive correlation was shown between RDW and micrototal UPCR in our study, this correlation did not reach statistical significance. Previous work suggested that RDW and UPCR are related through chronic inflammation and oxidative stress, neurohumoral overactivity, and endothelial dysfunction mechanisms. However, the trend of significance (P = .052) suggested that results could become more meaningful by evaluating larger patient groups.
An important consideration is the interpretation of statistically significant intergroup differences despite weak or borderline correlation coefficients. Group-based comparisons may capture threshold or nonlinear effects of RDW that are not adequately reflected by correlation analyses. This finding sug-gested that RDW may function more effectively as a categorical or stratification marker rather than a con-tinuous linear predictor in certain clinical contexts.
When all patients were evaluated, although there was no significant association between RDW and UPCR (r = 0.177, P = .052), when evaluated in terms of subgroups, the mean value of UPCR was 756.96 ± 68.4 mg/day in group 1 and 1114.64 ± 84.62 mg/g in group 2. The difference between the groups was strongly significant (P < .001). When RDW was increased above the normal value (14.5 fL), the UPCR of patients also increased significantly compared with group 1.
Our study found an important relationship not only between RDW and PTH level (r = 0.305, P < .01) but also between RDW and 25-hydroxyvitamin D3 level (r = 0.192, P = .034). Because of the overex-pression of renin transcription from 25-hydrox-yvitamin D3 decrease, and by this means direct cellular effects such as inflammation and fibrosis causing podocyte loss and glomerulosclerosis, a significant relationship between RDW and 25-hydroxyvitamin D3 level was expected.19-21
A positive noteworthy association was shown between RDW and hsCRP (r = 0.189, P = .037). Increa-sed proinflammatory cytokines, vascular adhesion molecules, hsCRP, and fibrinogen have been shown to be responsible for endothelial dysfunction and to be associated with microalbuminuria in hypertensive patients,22,23 as shown in our study in the relationship shown between hsCRP and RDW that we obtained in KTRs.
Our study also showed significant positive cor-relation between HbA1c and RDW levels (r = 0.192; P = .034). This finding was supported by Weiss and colleagues, which explained that the mechanism by inflammatory process due to chronic hyperglycemia would affect erythrocyte formation, half-life and deformation of erythrocytes, and raise RDW level by causing anisocytosis.24
In our study, group 1 (RDW <14.5) had RDW of 13.29 fL and group 2 (RDW≥14.5) had RDW of 15.8 fL (p <0.01). When these groups were compared, significant differences were shown between median results of hsCRP, intact PTH, serum 25-hydroxy-vitamin D3, and UPCR values (all P < .05. In group 2, median hsCRP, intact PTH, and UPCR values were higher than in group 1. Similarly, serum 25-hydroxyvitamin D3 level in group 2 was significantly lower than in group 1 (Table 2). The decreased serum 25-hydroxyvitamin D3 in group 2 may be associated with the inhibitory effect of vitamin D on proin-flammatory processes and low serum 25-hydroxy-vitamin D3 levels in KTRs. Thus, RDW is an important inflammation marker, such as serum 25-hydroxyvitamin D3 level. Other metabolic parameters such as age, hemoglobin level, mean corpuscular volume, and electrolyte level showed no significant correlation with RDW.
Although multivariable adjustment was not performed in this cross-sectional analysis, previous studies in both transplant and nontransplant popu-lations have suggested that RDW may retain clinical relevance even after adjustment for traditional inflammatory and hematologic markers. In this regard, RDW may be considered an integrative biomarker reflecting the combined effects of inflammation, nutritional status, renal function, and bone marrow response. Future prospective studies with larger cohorts and comprehensive covariate adjustment are warranted to clarify the independent role of RDW in follow-up of KTRs.
Limitations
Our study had some limitations. With a retrospective and cross-sectional study design, we could not examined whether RDW values of KTRs changed with the course of proteinuria level, concomitant diseases, and drugs used. A prospective analyses in groups with more homogeneous distribution could better reveal the relationship of RDW with other parameters. In addition, residual confounding related to anemia etiology, iron status, inflammatory burden, and immunosuppressive regimens could not be excluded.
Conclusions
Increased RDW values in stable KTRs were as-sociated with increased inflammatory markers, greater proteinuria, and alterations in bone mineral metabolism. Given the cross-sectional design of the study, causal relationships could not be inferred, and the findings should be interpreted cautiously. We suggest that RDW may be considered an adjunctive and easily accessible biomarker reflecting the overall inflammatory and hematologic milieu rather than a standalone diagnostic or prognostic indicator. Pros-pective longitudinal studies are needed to determine the independent clinical value and potential role of RDW in long-term transplant monitoring.
References:
- Aydoğdu İ. Kan sayım sonuçlarını nasıl yorumlamalıyız? Türk Hematoloji Derneği. 2002:13-17. Accessed May 9, 2017. http://www.thd.org.tr/thdData/userfiles/file/kan_sayim.pdf
CrossRef - PubMed - Evans TC, Jehle D. The red blood cell distribution width. J Emerg Med. 1991;9 Suppl 1:71-74. doi:10.1016/0736-4679(91)90592-4
CrossRef - PubMed - Bilal A, Farooq JH, Kiani I, Assad S, Ghazanfar H, Ahmed I. Importance of mean red cell distribution width in hypertensive patients. Cureus. 2016;8(11):e902. doi:10.7759/cureus.902
CrossRef - PubMed - Anderson JL, Ronnow BS, Horne BD, et al. Usefulness of a complete blood count-derived risk score to predict incident mortality in patients with suspected cardiovascular disease. Am J Cardiol. 2007;99(2):169-174. doi:10.1016/j.amjcard.2006.08.015
CrossRef - PubMed - Tonelli M, Sacks F, Arnold M, et al. Relation between red blood cell distribution width and cardiovascular event rate in people with coronary disease. Circulation. 2008;117(2):163-168. doi:10.1161/CIRCULATIONAHA.107.727545
CrossRef - PubMed - Ntaios G, Gurer O, Faouzi M, Aubert C, Michel P. Red cell distribution width does not predict stroke severity or functional outcome. Int J Stroke. 2012;7(1):2-6. doi:10.1111/j.1747-4949.2011.00609.x
CrossRef - PubMed - Ye Z, Smith C, Kullo IJ. Usefulness of red cell distribution width to predict mortality in patients with peripheral artery disease. Am J Cardiol. 2011;107(8):1241-1245. doi:10.1016/j.amjcard.2010.12.023
CrossRef - PubMed - Felker GM, Allen LA, Pocock SJ, et al. Red cell distribution width as a novel prognostic marker in heart failure: data from the CHARM Program and the Duke Databank. J Am Coll Cardiol. 2007;50(1):40-47. doi:10.1016/j.jacc.2007.02.067
CrossRef - PubMed - Zorlu A, Bektasoglu G, Guven FM, et al. Usefulness of admission red cell distribution width as a predictor of early mortality in patients with acute pulmonary embolism. Am J Cardiol. 2012;109(1):128-134. doi:10.1016/j.amjcard.2011.08.015
CrossRef - PubMed - Abul Y, Ozsu S, Korkmaz A, Bulbul Y, Orem A, Ozlu T. Red cell distribution width: a new predictor for chronic thromboembolic pulmonary hypertension after pulmonary embolism. Chron Respir Dis. 2014;11(2):73-81. doi:10.1177/1479972314525057
CrossRef - PubMed - Pierce CN, Larson DF. Inflammatory cytokine inhibition of erythropoiesis in patients implanted with a mechanical circulatory assist device. Perfusion. 2005;20(2):83-90. doi:10.1191/0267659105pf793oa
CrossRef - PubMed - Kato H, Ishida J, Imagawa S, et al. Enhanced erythropoiesis mediated by activation of the renin-angiotensin system via angiotensin II type 1a receptor. FASEB J. 2005;19(14):2023-2025. doi:10.1096/fj.05-3820fje
CrossRef - PubMed - Biaggioni I, Robertson D, Krantz S, Jones M, Haile V. The anemia of primary autonomic failure and its reversal with recombinant erythropoietin. Ann Intern Med. 1994;121(3):181-186. doi:10.7326/0003-4819-121-3-199408010-00004
CrossRef - PubMed - Afonso L, Zalawadiya SK, Veeranna V, Panaich SS, Niraj A, Jacob S. Relationship between red cell distribution width and microalbuminuria: a population-based study of multiethnic representative US adults. Nephron Clin Pract. 2011;119(4):c277-282. doi:10.1159/000328918
CrossRef - PubMed - Cameron JS. Proteinuria and progression in human glomerular diseases. Am J Nephrol. 1990;10 Suppl 1:81-87. doi:10.1159/000168199
CrossRef - PubMed - Zoja C, Corna D, Camozzi D, et al. How to fully protect the kidney in a severe model of progressive nephropathy: a multidrug approach. J Am Soc Nephrol. 2002;13(12):2898-2908. doi:10.1097/01.asn.0000034912.55186.ec
CrossRef - PubMed - Rosenkranz AR, Mayer G. Proteinuria in the transplanted patient. Nephrol Dial Transplant. 2000;15(9):1290-1292. doi:10.1093/ndt/15.9.1290
CrossRef - PubMed - Briganti EM, Russ GR, McNeil JJ, Atkins RC, Chadban SJ. Risk of renal allograft loss from recurrent glomerulonephritis. N Engl J Med. 2002;347(2):103-109. doi:10.1056/NEJMoa013036
CrossRef - PubMed - Li YC, Kong J, Wei M, Chen ZF, Liu SQ, Cao LP. 1,25-Dihydroxyvitamin D(3) is a negative endocrine regulator of the renin-angiotensin system. J Clin Invest. 2002;110(2):229-238. doi:10.1172/JCI15219
CrossRef - PubMed - Schwarz U, Amann K, Orth SR, Simonaviciene A, Wessels S, Ritz E. Effect of 1,25 (OH)2 vitamin D3 on glomerulosclerosis in subtotally nephrectomized rats. Kidney Int. 1998;53(6):1696-1705. doi:10.1046/j.1523-1755.1998.00951.x
CrossRef - PubMed - Mizobuchi M, Morrissey J, Finch JL, et al. Combination therapy with an angiotensin-converting enzyme inhibitor and a vitamin D analog suppresses the progression of renal insufficiency in uremic rats. J Am Soc Nephrol. 2007;18(6):1796-1806. doi:10.1681/ASN.2006091028
CrossRef - PubMed - Tsioufis C, Dimitriadis K, Stefanadis C, Kallikazaros I. The emerging role of subclinical inflammation in hypertension-associated early renal dysfunction: focus on microalbuminuria. Hellenic J Cardiol. 2006;47(6):361-365.
CrossRef - PubMed - Pedrinelli R, Dell'Omo G, Di Bello V, et al. Low-grade inflammation and microalbuminuria in hypertension. Arterioscler Thromb Vasc Biol. 2004;24(12):2414-2419. doi:10.1161/01.ATV.0000147415.40692.7f
CrossRef - PubMed - Weiss G, Goodnough LT. Anemia of chronic disease. N Engl J Med. 2005;352(10):1011-1023. doi:10.1056/NEJMra041809
CrossRef - PubMed

Volume : 24
Issue : 8
Pages : 619 - 625
DOI : 10.6002/ect.2025.0272
From the 1Department of Internal Medicine, Bossasn Hospital, Gaziantep, Türkiye; the 2Department of Nephrology, Gaziantep University, Gaziantep, Türkiye; and the 3Department of Neurology, Bossasn Hospital, Gaziantep, Türkiye
Acknowledgements: The authors have not received any funding or grants in support of the presented research or for the preparation of this work and have no declarations of potential conflicts of interest.
*Celalettin Usalan and Şeyda Güneri contributed equally to this work.
Corresponding author: Mehmet C. Güneri, Department of Internal Medicine, Bossan Hospital, Gaziantep, Türkiye
E-mail: drmehmetguneri@msn.com
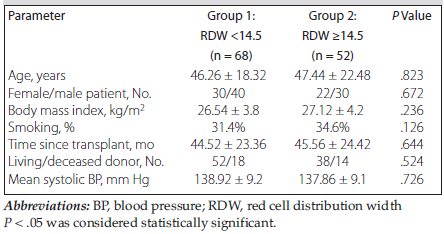
Table 1. Baseline Demographic and Clinical Characteristics of Kidney Transplant Recipients According to Red Cell Distribution Width
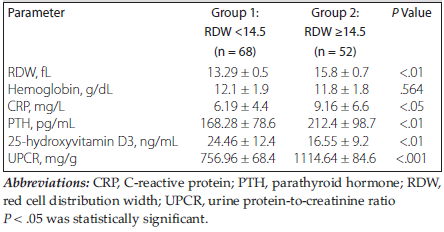
Table 2. Comparison of laboratory parameters between low and high red cell distribution width groups in kidney transplant recipients
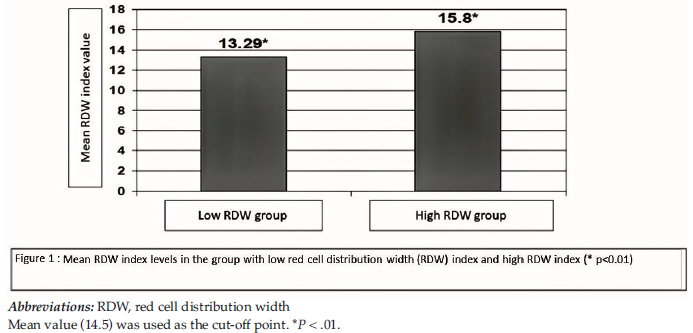
Figure 1. Red Cell Distribution Width Among Kidney Transplant Recipients
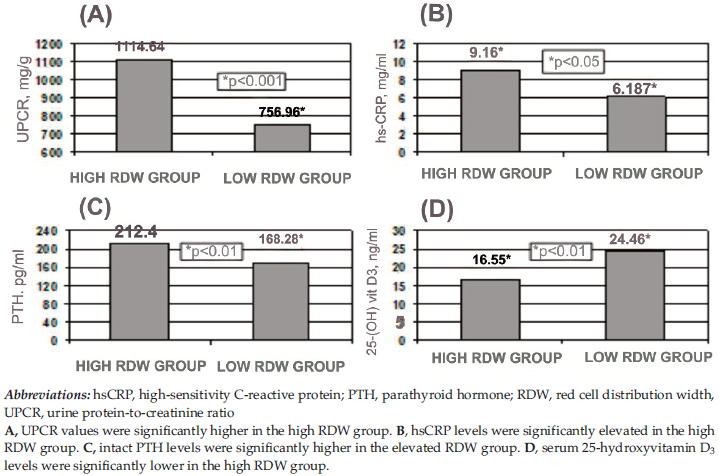
Figure 2. Comparison of Laboratory Parameters Between Red Cell Distribution Width Groups
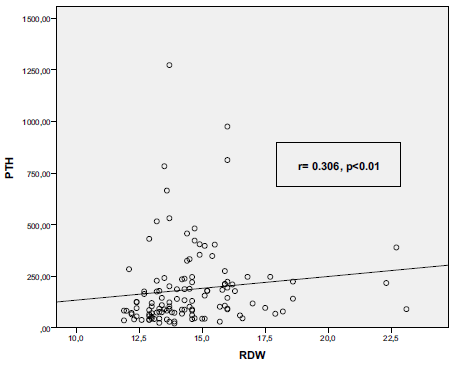
Figure 3. Scatter Plot Showing Correlation Between Red Cell Distribution Width and Parathyroid Hormone
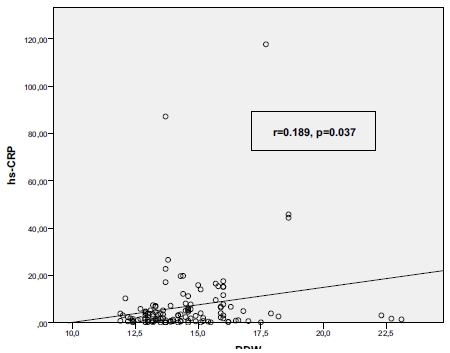
Figure 4. Scatter Plot Showing Correlation Between Red Cell Distribution Width and High-Sensitivity C-Reactive Protein
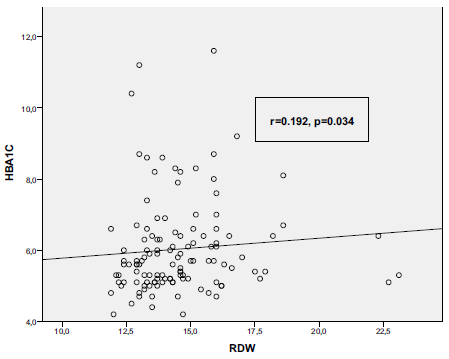
Figure 5. Scatter Plot Showing Correlation Between Red Cell Distribution Width and Glycosylated Hemoglobin
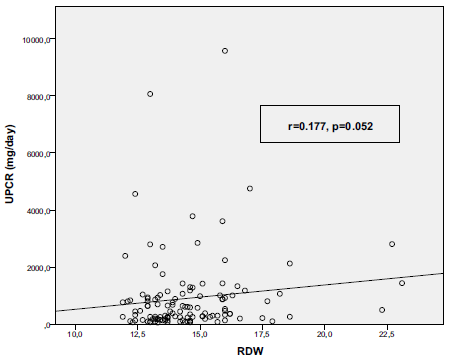
Figure 6. Scatter Plot Showing Correlation Between Red Cell Distribution Width and Urine Protein-To-Creatinine Ratio