Volume: 24 Issue: 8 August 2026
FULL TEXT
Parathyroid Hormone Threshold Effect and Parathyroid Hormone-to-Vitamin D Ratio as Determinants of Bone Mineral Density in Long-Term Kidney Transplant Recipients: A Cross-Sectional Analytical Study
Objectives: Persistent hyperparathyroidism and calci-triol deficiency coexist in most long-term kidney transplant recipients, yet the combined skeletal effects of these presentations have not been formally quantified.
Materials and Methods: In this cross-sectional analytical study at People’s Hospital 115 (Ho Chi Minh City, Vietnam), we studied 135 kidney transplant recipients (mean age 51.0 ± 11.3 years; 66.7% male; mean time posttransplant 71.4 ± 28.1 months) who underwent simultaneous measurement of serum intact parathyroid hormone, 1,25-dihydroxyvitamin D, and dual-energy x-ray absorptiometry at 3 skeletal sites. A prespecified piecewise ordinary least-squares model characterized the relationship between parathyroid hormone and bone mineral density; a confirmatory sensitivity analysis used KDIGO-motivated breakpoint of 65 pg/mL for parathyroid hormone. We evaluated parathyroid hormone-to-vitamin D ratio as a prespecified secondary exposure measure.
Results: Bone loss (worst-site T score of < -1.0) was present in 103 participants (76.3%) and osteoporosis in 27 (20.0%). The confirmatory piecewise model at 65 pg/mL demonstrated that above-threshold parathyroid hormone was inversely associated with T-score composite (β = -0.00367 per pg/mL; bootstrap 95% CI, -0.0066 to -0.0013; P < .001), a 100 pg/mL increment above the threshold corresponded to a -0.37 T-score decrement. Body mass index was the strongest predictor (β = +0.129 per kg/m2; P < .001). The ratio of parathyroid hormone to vitamin D (ρ = -0.262; P = .002) provided modestly better model fit than parathyroid hormone alone (R2 = 0.247 vs 0.229; change in Akaike Information Criterion = 3.2).
Conclusions: Parathyroid hormone exerted a threshold-dependent inverse effect on bone mineral density in long-term kidney transplant recipients, confirmed at the KDIGO lower boundary of 65 pg/mL. The ratio of parathyroid hormone to vitamin D captured the combined mineral burden more efficiently than parathyroid hormone level alone, warranting further prospective evaluation as a monitoring target in posttransplant mineral disease.
Key words : Calcitriol deficiency, Composite T score, DEXA, Piecewise regression, Renal osteodystrophy
Introduction
Fracture risk is elevated 3- to 4-fold in kidney transplant recipients compared with the general population,1 and the skeletal burden does not resolve with restoration of graft function.2,3 Persistent posttransplant secondary hyperparathyroidism, defined as serum intact parathyroid hormone (PTH) level exceeding the upper normal limit beyond 3 months posttransplant, affects 60% to 80% of recipients and represents the dominant unresolved mineral disturbance in this population.4-6 Sustained PTH excess drives osteoclast-mediated cortical resorption through the RANKL/RANK axis and is independently associated with graft loss, excess cardiovascular mortality, and fracture.6,7 Perrin and colleagues documented a 7-fold increase in fracture hazard over 5 years posttransplant in recipients with PTH exceeding 130 ng/L at 3 months,8 and Crepeau and colleagues reported a 4-fold increase in graft loss when PTH exceeded 300 pg/mL at 1 year.7
Whether the relationship between PTH and bone mineral density (BMD) in kidney transplant recipients is linear or follows a threshold pattern remains formally uncharacterized.9 A threshold relationship, with bone loss concentrated above a critical PTH value, would have direct clinical implications and define a targetable intervention zone rather than a continuous gradient of risk. The Kidney Disease Improving Global Outcomes (KDIGO) 2017 acknowledged uncertainty about the optimal posttransplant PTH target (section 5.5, grade 2D [very low certainty evidence]),10 and the 2025 KDIGO Controversies Conference concluded that current evidence is insufficient to refine this target.11 Therefore, the formal characterization of the PTH-BMD functional form in long-term post-transplant recipients is a prerequisite for evidence-based monitoring guidelines.12
A second knowledge gap concerns the concurrent effect of calcitriol deficiency. In kidney transplant recipients, 1,25-dihydroxyvitamin D is frequently reduced as a result of residual CYP27B1 impairment proportional to graft function loss, sustained FGF-23 excess, and glucocorticoid-mediated suppression of intestinal vitamin D receptor expression.13,14 Parathyroid hormone and calcitriol are functional antagonists in bone metabolism: elevated PTH promotes RANKL-driven resorption, whereas defi-cient calcitriol fails to support osteoblast differen-tiation and exerts feedback inhibition of parathyroid chief cells through vitamin D receptor activation.15 These 2 disturbances plausibly compound each other in a manner that neither marker captures alone, yet no published study has formally evaluated an integrated PTH-to-calcitriol index as a predictor of BMD in this population.
In a long-term cohort of kidney transplant rec-ipients at People’s Hospital 115 (Ho Chi Minh City, Vietnam), a tertiary center with a large posttransplant surveillance program and a cohort characterized by prolonged mean immunosuppression exposure exceeding 5 years, we addressed both gaps. The present study had 2 prespecified objectives: (1) to characterize the functional form of the PTH-BMD relationship using a piecewise regression model, with the KDIGO posttransplant lower boundary of 65 pg/mL as the confirmatory breakpoint, and (2) to evaluate the PTH/vitamin D ratio as an integrated predictor of composite T score, testing whether this ratio provides better explanatory power than PTH alone. We hypothesized that the PTH-BMD asso-ciation would be nonlinear with a threshold near the KDIGO lower boundary and that the PTH/vitamin D ratio would explain greater BMD variance than either marker in isolation.
Materials and Methods
Study design and setting
This cross-sectional analytical study was conducted at the outpatient kidney transplant clinic of People’s Hospital 115 (Ho Chi Minh City, Vietnam) and enrolled consecutive eligible patients between January and December 2024. People’s Hospital 115 is a 1200-bed tertiary-care referral center that operates one of the largest posttransplant follow-up programs in southern Vietnam, providing routine annual surveillance that includes dual-energy x-ray absorp-tiometry (DEXA), biochemical mineral profiling, and immunosuppression monitoring. For study conduct, we followed the STROBE guidelines for cross-sectional studies. The cohort described here was previously characterized for mineral and bone disorder prevalence in a separate descriptive publication16; in this study, we addressed distinct prespecified analytical objectives using multivariable regression methods not reported in the previous publication.
Participants
Our cohort comprised all kidney transplant reci-pients attending scheduled outpatient follow-up who were at least 18 months posttransplant, an interval chosen to allow stabilization of immuno-suppression and resolution of the acute post-transplant bone loss phase.10 Consecutive sampling was used; all eligible attendees during the enrolment window were invited to participate.
Excluded patients were those who could be categorized in the following 3 groups. Group A was defined as patients with estimated glomerular filtration rate (eGFR) <15 mL/min/1.73 m2, active malignancy, or receipt of high-dose corticosteroid pulse therapy within the preceding 6 weeks (measurements unsafe or uninterpretable). Group B was defined as patients with primary hyper-parathyroidism, Paget disease, or hereditary metabolic bone disorder (alternative primary explanation for bone loss). Group C was defined as patients with body weight exceeding 130 kg, metallic lumbar or hip implants precluding scan interpretation, or cognitive impairment impairing consent capacity. Of 146 consecutive attendees assessed, 11 were excluded (5 according to group A, 3 according to group B, and 3 according to group C), yielding an analytic sample of 135 participants. Written informed consent was obtained from all participants before start of any study procedure.
Exposures and measurements
Serum intact PTH was measured by electrochemi-luminescence immunoassay (Roche Diagnostics, Cobas platform) on fasting morning blood samples drawn on the same day as DEXA. Serum 1,25-dihydroxyvitamin D (calcitriol) was measured by radioimmunoassay (DiaSorin). Although liquid chromatography-tandem mass spectrometry (LC-MS/MS) provides higher specificity for calcitriol quantification, radioimmunoassay was used as the method available within our center’s accredited laboratory, although with potential cross-reactivity with calcitriol metabolites. All assays were per-formed under standard internal quality control protocols including duplicate measurement, with exclusion of runs in which the interassay coefficient of variation exceeded 5%. Laboratory technicians were blinded to DEXA results at the time of analysis.
The PTH/vitamin D ratio was computed as serum intact PTH (pg/mL) divided by serum 1,25-OH vitamin D (ng/mL). This index was prespecified as a secondary exploratory exposure prior to data analysis. A clinical decision threshold of 5.0 (measured as pg/mL-to-ng/mL) was prespecified, derived from the intersection of the KDIGO posttransplant PTH upper target (150 pg/mL) and the vitamin D sufficiency threshold (30 ng/mL):
150 ÷ 30 = 5.0. This threshold is exploratory and was not used to guide clinical decisions within the study. Serum calcium, phosphorus, creatinine, fasting glucose, lipid profile, and hemoglobin were measured by standard automated methods on the same fasting sample. Calculation of eGFR was conducted with the CKD-EPI 2021 creatinine equation. Tacrolimus trough concentration was measured by chemi-luminescent microparticle immunoassay where clinically ordered.
Bone mineral density measurement
For DEXA, a Lunar Prodigy densitometer (GE Healthcare) was used with daily phantom calibration maintaining the coefficient of variation below 1.0%, per International Society for Clinical Densitometry (ISCD) 2019 guidelines. Lumbar spine BMD was assessed at L1 to L4; individual vertebral levels affected by compression fracture, pedicle screw hardware, or severe osteoarthritis were excluded from the regional mean. Femoral neck and total hip BMD were measured bilaterally; the lower T score of the 2 hips was used for osteoporosis classification, and bilateral mean was used in all regression analyses per ISCD recommendations. T scores were computed with the embedded NHANES III reference database (reference population included those aged 20-29 years, same sex). All scans were acquired by 1 of 2 ISCD-certified technicians and reported by a single radiologist blinded to PTH values and ratio values. Reproducibility assessed in 20 randomly selected participants rescanned within 2 weeks yielded an intraclass correlation coefficient of 0.97 (95% CI, 0.94-0.99) for total hip T score.
Outcomes
Co-primary outcomes included (1) prevalence of bone loss, defined as a worst-site T score below -1.0 using World Health Organization criteria (osteoporosis was T score < -2.5 and osteopenia was T score between -2.5 and -1.0), and (2) association between PTH and T score composite (ie, the arithmetic mean of femoral neck, total hip, and lumbar spine T scores) as a continuous outcome in multivariable regression. The composite was chosen a priori to increase statistical power and avoid inflation of type I error from multiple site-specific comparisons; site-specific models are reported as prespecified secondary outcomes (data not shown). Secondary outcomes included site-specific T scores, T-score composite stratified by PTH group, and T-score composite as a function of the PTH/vitamin D ratio. An exploratory secondary outcome was unexplained bone loss (UBL), defined as a standardized ordinary least-squares (OLS) residual below the 20th percentile (≤ -0.80 SD) from the core 5-predictor model; this framework is labeled exploratory throughout, and findings should be regarded as hypothesis-gene-rating only.
Statistical analyses
In primary multivariable analysis, we used OLS regression with T-score composite as the continuous outcome and the following 5 prespecified predictors: body mass index (BMI), age, menopausal status, time posttransplant, and PTH level. To characterize for-mally the PTH-BMD relationship, we used a piecewise linear model specified as follows: low = minimum (PTH, κ) and high = maximum (PTH, -κ, 0), where κ is the breakpoint. The breakpoint selection used a grid search of κ from 20 to 400 pg/mL at 5 pg/mL intervals maximizing R2; we presented the grid-search optimum (κ = 50 pg/mL) as descriptive/exploratory only. For the prespecified confirmatory sensitivity analysis, we used κ of 65 pg/mL (the KDIGO posttransplant lower boundary), which was selected independently of the grid result and before examination of outcomes; this is the primary inferential breakpoint. We evaluated the incremental fit of the piecewise over the linear model by F test. We used bootstrap confidence intervals (B = 1000, percentile method) as the primary inferential measure for all regression coefficients. We used variance inflation factors (<1.25 for all predictors) to confirm absence of meaningful multicollinearity. The Breusch-Pagan test yielded LM = 2.40 (P = .79). Mild residual nonnormality (Shapiro-Wilk W = 0.973; P = .009) was addressed by relying on bootstrap rather than asymptotic confidence intervals.
The PTH/vitamin D ratio model replaced PTH with the ratio using identical covariates; we com-pared models with Akaike information criterion (AIC). We estimated partial correlations, controlling for BMI, age, and time posttransplant by regressing each predictor and the outcome separately on the 3 covariates and computing the Pearson correlation of the 2 residual series. We assessed normality with the Shapiro–Wilk test. We presented normally distri-buted variables as mean ± SD and nonnormally distributed variables as median (interquartile range [IQR]). We used χ2 or the Fisher exact test for categorical comparisons.
We assessed candidate UBL predictors with multivariable logistic regression (27 events divided by 6 predictors = 4.5 events per variable [EPV], which is below the recommended threshold of 10 EPV; findings should therefore be regarded as strictly hypothesis generating) and with LASSO bootstrap stability analysis (B = 500, 5-fold cross-validation; all predictors standardized before entry). We conducted 5 prespecified sensitivity analyses: sex-stratified models (SA1), restriction to eGFR ≥45 mL/min/1.73 m2 (SA2), exclusion of calcium/vitamin D supplement users (SA3), log-transformed PTH (SA4), and log-transfor-med PTH/vitamin D ratio (SA5). All analyses were conducted in Python 3.11 (Pandas version 2.0.3, Statsmodels version 0.14.0, scikit-learn version 1.3.2, scipy version 1.11.4). We determined statistical significance as 2-sided α = 0.05.
The 5 primary predictors and the primary outcome had no missing data; primary analyses were complete case without imputation. Tacrolimus trough level was unavailable in 8 participants (5.9%) and pretransplant dialysis duration in 21 participants (15.6%); these variables were excluded from primary models and handled by available-case analysis in secondary analyses.
Ethics
The Institutional Review Board of Pham Ngoc Thach University of Medicine (approval number: QĐ 1056/TĐHYKPNT-HĐĐĐ; February 21, 2024) ap-proved the study. All procedures were conducted in accordance with the Declaration of Helsinki. Written informed consent was obtained from all participants before study enrolment. All 135 recipients received a kidney from a living donor who was a blood relative (up to the fourth degree) or spouse of the recipient; no organs were obtained from living unrelated donors, deceased donors, executed prisoners, or prisoners of conscience, and all donor evaluations followed institutional and national regulations for living-related donation consistent with the Declaration of Istanbul.
Results
Participants and baseline characteristics
Between January and December 2024, 146 con-secutive kidney transplant recipients attending routine outpatient follow-up were assessed for eligibility; 11 were excluded and 135 were enrolled and included in our analyses. Participants had a mean age of 51.0 ± 11.3 years (range, 22-77 y); 90 participants (66.7%) were male, and 45 participants (33.3%) were female, of whom 28 (62.2%) were postmenopausal. Mean time posttransplant was 71.4 ± 28.1 months, reflecting a long-term cohort with median immunosuppression exposure exceeding 5 years. Corticosteroid-based immunosuppression was used in 129 participants (95.6%) and tacrolimus in 127 (94.1%). Serum PTH was markedly elevated, with a median of 100.7 pg/mL (IQR, 74.5-140.9 pg/mL), consistent with persistent posttransplant hyperparat-hyroidism in most participants; this elevation occur-red despite generally preserved graft function (median eGFR of 81.3 mL/min/1.73 m2), consistent with autonomous (tertiary) PTH secretion from hyperplastic parathyroid glands. Additional baseline characteristics are presented in Table 1.
Prevalent bone loss, affecting more than three-quarters of participants
Clinically significant bone loss (worst-site T score of < -1.0) was present in 103 of 135 participants (76.3%; 95% CI, 68.9%-83.0%) (Table 2). Osteoporosis (T score of < -2.5) was identified in 27 participants (20.0%; 95% CI, 13.3%-26.7%) and osteopenia in 76 participants (56.3%). Mean T-score composite was -1.13 ± 1.05.
T-score distributions were similar across the 3 DEXA sites (femoral neck: -1.08 ± 1.18; total hip: -1.07 ± 1.16; lumbar spine: -1.25 ± 1.31), with the lumbar spine showing marginally greater bone loss, consistent with the predominant trabecular composition of vertebral bone and its well-characterized sensitivity to glucocorticoid exposure (Table 2).
Association of parathyroid hormone with lower T score in a nonlinear threshold pattern The grid-search exploratory analysis identified a descriptive optimum at κ = 50 pg/mL (R2 = 0.267 vs linear R2 = 0.229; F = 6.64; P = .011). The subthreshold segment (κ ≤50 pg/mL) encompassed only 10 par-ticipants and yielded an unstable slope (β = +0.037; bootstrap 95% CI, -0.012 to +0.071) that did not reach significance after bootstrap correction; this segment should not be interpreted as evidence of a positive PTH effect on bone.
The prespecified confirmatory analysis at κ = 65 pg/mL (KDIGO lower boundary, selected inde-pendently of the grid result) demonstrated that above-threshold PTH was significantly and inversely associated with T-score composite (β = -0.00367 per pg/mL; bootstrap 95% CI, -0.0066 to -0.0013; P < .001). A 100 pg/mL increment in PTH above 65 pg/mL was associated with a mean T-score decrement of 0.37 (95% CI, 0.13 to 0.66). This estimate was robust to all prespecified sensitivity analyses (Table 3). Body mass index was the strongest predictor in all model specifications (β = +0.129 per kg/m2; bootstrap 95% CI, 0.071-0.197; P < .001) (Figure 1D). Age, menopausal status, and time post-transplant did not reach independent significance in the multivariable model (data not shown).
In categorical analysis across 3 prespecified
PTH groups of low (<65 pg/mL; n = 29), target
(65-150 pg/mL; n = 75), and elevated (>150 pg/mL; n = 31) levels, T-score composite differed signifi-cantly (one-way analysis of variance [ANOVA]: F = 4.75; P = .010). Bonferroni post hoc comparison identified a significant difference between the 65 to 150 pg/mL group (mean -0.99 ± 1.03) and the >150 pg/mL group (mean -1.63 ± 0.72; adjusted P = .046) but not between the <65 pg/mL group and the other comparators (both adjusted P > .09), the latter likely reflecting limited power in the low-PTH stratum (n = 29) (Table 2; Figure 1B).
Time-stratified analysis suggesting stronger parathyroid hormone-bone mineral density association in the early posttransplant period In a prespecified stratified analysis at the sample median of 66 months posttransplant, the Spearman correlation between PTH and T-score composite was significant in the early stratum (ρ = -0.313; P = .009; n = 68) but attenuated and not significant in the late stratum (ρ = -0.092; P = .458; n = 67) (Figure 1E).
The Fisher z-test for the difference between the 2 correlation coefficients did not reach statistical significance (z = -1.31; P = .19), and PTH was not significantly associated with time posttransplant (ρ = -0.064; P = .459), indicating the apparent atte-nuation was not attributable to spontaneous PTH resolution over time. This pattern is consistent with progressive adaptation of bone turnover over the posttransplant course, including increasing preva-lence of low-turnover adynamic bone disease, which may partially decouple PTH from BMD in long-term recipients.17 This finding should be considered hypothesis-generating and warrants prospective confirmation with serial bone biopsy data.
Inverse relationship between parathyroid hor-mone/vitamin D ratio and T score, showing better model fit than parathyroid hormone alone Median PTH/vitamin D ratio was 4.66 (IQR, 2.57-7.68; range, 0.02-36.42) (Figure 2A). The result was significantly and inversely associated with
T-score composite in multivariable OLS regression
(β = -0.046 per unit; bootstrap 95% CI, -0.071 to -0.020; P < .001). The ratio model provided modestly better fit than the PTH-only model (R2 = 0.247 vs 0.229; AIC = 370.0 vs 373.2; change in AIC = 3.2), with the ratio bootstrap 95% CI lying entirely below 0 across all 1000 iterations. After analyses controlled for BMI, age, and time posttransplant, the partial correlation between the ratio and T-score composite was -0.310 (P < .001); partial correlations at individual DEXA sites ranged from -0.250 (lumbar spine) to -0.283 (total hip), which were all significant (Figure 2D).
Participants with ratio above the prespecified threshold of 5.0 (n = 61; 45.2%) had a mean T-score composite of -1.49 ± 0.84 compared with -0.84 ± 1.13 in those at or below the threshold (n = 74; 54.8%), showing a mean difference of -0.65 T-score units (t = -3.74; P < .001) (Figure 2E). Osteoporosis preva-lence was 31.1% in the group with ratio >5.0 versus 10.8% in the group with ratio ≤5.0. Across the 4 prespecified ratio quartiles, T-score composite differed significantly (ANOVA F = 4.04; P = .009; Spearman trend ρ = -0.262; P = .002), with the steepest decrement observed in quartile 4 (ratio of >7.68) (Figure 2B).
Robust primary findings across prespecified sensitivity analyses
Both the PTH threshold association (confirmatory κ = 65 analysis) and the ratio-BMD association were preserved in male participants (PTH β = -0.0037, P = .001; ratio β = -0.051, P = .001; n = 90), when restricted to eGFR ≥45 mL/min/1.73 m2 (n = 126), and when calcium/vitamin D supplement users were excluded (n = 116). In female participants (n = 45), both associations were attenuated and not significant, consistent with reduced power given the small stratum size; formal sex-by-PTH and sex-by-ratio interaction terms were not significant (P = .12 and P = .31, respectively). Log-transformation of the ratio confirmed the association (β = -0.270; P = .005), cor-responding to a -0.19 T-score decrement per doubling of the ratio (Table 3).
Exploratory analyses showing inverse relationship between dyslipidemia status and unexplained bone loss
In exploratory analyses, the core OLS model exp-lained 22.9% of the variance in T-score composite (adjusted R2 = 0.199). The 27 participants (20.0%) whose standardized residuals fell below the 20th percentile were designated as having UBL. In multivariable logistic regression (EPV = 4.5, below recommended minimum; results are hypothesis-generating only), a clinical diagnosis of dyslipidemia was associated with lower odds of UBL (adjusted odds ratio = 0.29; 95% CI, 0.12-0.75; P = .010). LASSO bootstrap stability analysis identified dyslipidemia as the most consistently selected predictor (selection frequency 68.8%), followed by tacrolimus trough level (61.2%) and 1,25-OH vitamin D level (46.4%). These findings raise the hypothesis that dyslipidemia status, possibly as a surrogate for statin use, may be associated with measurably better-than-expected BMD in long-term transplant recipients; prospective investigations with explicit statin documentation are needed before any clinical conclusion can be drawn.
Discussion
In long-term kidney transplant recipients, PTH exerted a threshold-dependent inverse effect on BMD, which was confirmed at the KDIGO posttransplant lower boundary of 65 pg/mL, independent of BMI and other clinical covariates. The PTH/vitamin D ratio, an integrated index of PTH excess and calcitriol deficiency, explained additional BMD variance and provided a better model fit than PTH alone, with associations consistent across all 3 skeletal sites and across all prespecified sensitivity analyses.
The threshold pattern was consistent with established PTH receptor physiology. At low-to-normal concentrations, intermittent or low-level PTH receptor activation has been shown to promote anabolic Wnt signaling in osteoblasts; above a critical concentration, sustained activation has been shown to shift the net balance toward RANKL-driven osteoclastic resorption, predominantly of cortical bone.18 The categorical analyses supported this interpretation: the meaningful BMD deficit was concentrated in the >150 pg/mL stratum (mean T-score composite of -1.63 ± 0.72 vs -0.99 ± 1.03 in the 65-150 pg/mL group; P = .046), whereas the <65 pg/mL group did not differ from either comparator. Perrin and colleagues previously documented that PTH >130 ng/L at 3 months posttransplant was associated with a 7-fold increase in fracture hazard over 5 years,8 and Crepeau and colleagues demonstrated a 4-fold increase in graft loss with PTH >300 pg/mL.7 Our data extended these observations by formally characterizing the functional PTH-BMD relationship in long-term follow-up, demonstrating that the bone cost of PTH excess was not uniformly distributed but was concentrated above the KDIGO lower boundary (a range encompassing 78.5% of our cohort), higher than the 49% to 62.5% reported in shorter follow-up cohorts,12,19 consistent with progressive skeletal burden accumulation.
The time-stratified analysis revealing a stronger PTH-BMD association in the early posttransplant period (ρ = -0.313; P = .009) compared with the later (ρ = -0.092; P = .458) deserves comment. This attenuation was not attributable to PTH resolution, as PTH was not significantly associated with time posttransplant in our cohort. A more plausible explanation was the progressive accumulation of low-turnover adynamic bone disease over time: because glucocorticoid exposure suppresses bone formation, bone increasingly fails to respond to resorptive PTH signaling, partially decoupling the PTH-BMD relationship.20,21 This is clinically important; the window during which PTH control most directly protects BMD may be concentrated in the first 5 years posttransplant, supporting early rather than deferred intervention in recipients with above-target PTH.
The PTH/vitamin D ratio performed consistently better than PTH alone. The pathophysiological ratio-nale is straightforward: calcitriol deficiency is near universal in this population, driven by residual CYP27B1 impairment, sustained FGF-23 excess, and glucocorticoid-mediated suppression of vitamin D receptor expression.13 When PTH is elevated and calcitriol is simultaneously deficient, the bone is exposed to pro-resorptive signaling without the counterbalancing pro-formative influence of vitamin D receptor activation in osteoblasts.15 The impro-vement in model fit was most notable at the femoral neck, a cortical-predominant site where PTH alone did not reach significance (P = .019 before multiplicity adjustment) but the ratio did (partial r = -0.271; P = .002). This finding was consistent with the known susceptibility of cortical bone to combined PTH excess and vitamin D deficiency.22 A ratio of >5.0 corresponded to a 0.65 T-score unit deficit and a 3-fold higher osteoporosis prevalence (31.1% vs 10.8%), an effect magnitude clinically relevant to fracture risk stratification. The log-transformed sensitivity analysis (β = -0.270; P = .005; -0.19 T-score per ratio doubling) confirmed the association was not driven by outliers.
The exploratory finding that dyslipidemia status was inversely associated with unexplained bone loss (adjusted odds ratio = 0.29; P = .010) is hypothesis-generating only and should be interpreted with caution. With EPV = 4.5 and a proxy variable (dyslipidemia clinical diagnosis) that encompasses statin-treated patients with normalized lipids, the biological signal cannot be distinguished from confounding by statin use at this sample size. Statins stimulate bone formation by upregulating BMP-2 expression in osteoblasts,23 and Mendelian ran-domization evidence has supported a positive causal effect of low LDL-cholesterol on BMD.24 Whether statins confer a measurable skeletal benefit in kidney transplant recipients exposed to concurrent immuno-suppression effects requires a prospective study with explicit statin documentation.
Our study had some limitations. First, the cross-sectional design precluded causal inference; the threshold and ratio associations, reflecting population differences at a single time point, cannot be interpreted as evidence that PTH reduction within an individual will produce the modeled T-score improvement. Second, the grid-search optimum (κ = 50 pg/mL) was selected on the same data used for inference, inflating the type I error; the con-firmatory analysis at the prespecified κ = 65 pg/mL partially addressed this, but external validation in an independent cohort is required before the threshold can be considered established. Similarly, the PTH/vitamin D ratio and its prespecified clinical cutoff of 5.0 were derived surrogate indices developed in this single cohort and have not been externally validated; they should be regarded as hypothesis-generating monitoring targets that require confirmation in an independent, prospectively en-rolled cohort before use in the clinical. Third, calcitriol was measured by radioimmunoassay rather than liquid chromatography-tandem mass spectrometry (the current gold standard); potential cross-reactivity with calcitriol metabolites can introduce measure-ment error into the ratio, likely attenuating its association with BMD (conservative bias). Fourth, bone biopsy (the gold standard for differentiating turnover subtypes) was not performed; the relative contributions of high-turnover resorptive disease and low-turnover adynamic bone disease to the observed BMD deficit could not be determined, and this distinction is clinically critical before antiresorptive therapy is considered, as bisphosp-honates may worsen adynamic bone disease.20,25 Fifth, the analytic sample was drawn from a single center in southern Vietnam comprising predominantly middle-aged men with high corticosteroid and tacro-limus exposure; associations may not generalize to populations with different immunosuppression protocols, ethnicity, or pretransplant dialysis duration. Sixth, the female-only subgroup (n = 45) was underpowered for sex-stratified inference; a formal power calculation suggested at least 120 female participants would be required to achieve 80% power for the PTH effect size observed in males. Seventh, calcium/vitamin D and other coadministered medi-cations were captured only as a binary supplement-use flag; dose, duration, and formulation were not recorded, and sensitivity analysis SA3 (exclusion of supplement users) therefore could not fully control for dose-dependent effects on calcitriol or PTH, a residual confounding source that should be addressed with dose-level data in future studies. Finally, fracture incidence data were not available, limiting the clinical translation of BMD findings.
The 2025 KDIGO Controversies Conference concluded that the optimal posttransplant PTH target remains uncertain and that calcitriol deficiency warrants more systematic attention in posttransplant monitoring protocols.11 Our findings provided quan-titative support for a specific PTH zone (>65 pg/mL and particularly >150 pg/mL) as the primary skeletal risk range and for simultaneous monitoring of calcitriol to contextualize PTH-driven resorptive risk. Cinacalcet, active vitamin D analogues, and denosumab have demonstrated the ability to modify one or both components of this risk26-29; a prospective randomized trial targeting the PTH/vitamin D ratio as a composite treatment endpoint, with fracture as the primary outcome, would provide the evidence base currently absent from guidelines.
Conclusions
In long-term kidney transplant recipients, PTH exerted a threshold-dependent inverse effect on BMD that is confirmed at the KDIGO posttransplant lower boundary of 65 pg/mL, with the clinically relevant bone cost concentrated in the >150 pg/mL range. The PTH/vitamin D ratio captured the combined mineral burden, integrating PTH-driven resorption and calcitriol-deficiency-driven impair-ment of bone formation more efficiently than PTH alone. Routine co-measurement of intact PTH and 1,25-dihydroxyvitamin D is clinically feasible and may improve individual risk stratification in post-transplant mineral disease management. Prospective trials targeting the PTH/vitamin D ratio as a treatment endpoint, with fracture incidence as the primary outcome, are warranted to translate these findings into evidence-based practice.
References:
- Anastasilakis AD, Tsourdi E, Makras P, et al. Bone disease following solid organ transplantation: a narrative review and recommendations for management from The European Calcified Tissue Society. Bone. 2019;127:401-418. doi:10.1016/j.bone.2019.07.006
CrossRef - PubMed - Kim KJ, Ha J, Kim SW, et al. Bone loss after solid organ transplantation: a review of organ-specific considerations. Endocrinol Metab (Seoul). 2024;39(2):267-282. doi:10.3803/EnM.2024.1939
CrossRef - PubMed - Kuppachi S, Cheungpasitporn W, Li R, et al. Kidney transplantation, immunosuppression and the risk of fracture: clinical and economic implications. Kidney Med. 2022;4(6):100474. doi:10.1016/j.xkme.2022.100474
CrossRef - PubMed - Sutton W, Chen X, Patel P, et al. Prevalence and risk factors for tertiary hyperparathyroidism in kidney transplant recipients. Surgery. 2022;171(1):69-76. doi:10.1016/j.surg.2021.03.067
CrossRef - PubMed - Evenepoel P, Claes K, Kuypers D, Maes B, Bammens B, Vanrenterghem Y. Natural history of parathyroid function and calcium metabolism after kidney transplantation: a single-centre study. Nephrol Dial Transplant. 2004;19(5):1281-1287. doi:10.1093/ndt/gfh128
CrossRef - PubMed - Khairallah P, Nickolas TL. Bone and mineral disease in kidney transplant recipients. Clin J Am Soc Nephrol. 2022;17(1):121-130. doi:10.2215/CJN.03410321
CrossRef - PubMed - Crepeau P, Chen X, Udyavar R, et al. Hyperparathyroidism at 1 year after kidney transplantation is associated with graft loss. Surgery. 2023;173(1):138-145. doi:10.1016/j.surg.2022.07.031
CrossRef - PubMed - Perrin P, Caillard S, Javier R, et al. Persistent hyperparathyroidism is a major risk factor for fractures in the five years after kidney transplantation. Am J Transplant. 2013;13(10):2653-2663. doi:10.1111/ajt.12425
CrossRef - PubMed - Akaberi S, Lindergård B, Simonsen O, Nyberg G. Impact of parathyroid hormone on bone density in long-term renal transplant patients with good graft function. Transplantation. 2006;82(6):749-752. doi:10.1097/01.tp.0000230130.50451.78
CrossRef - PubMed - Ketteler M, Block GA, Evenepoel P, et al. Diagnosis, evaluation, prevention, and treatment of chronic kidney disease–mineral and bone disorder: synopsis of the kidney disease: Improving Global Outcomes 2017 Clinical Practice guideline update. Ann Intern Med. 2018;168(6):422-430. doi:10.7326/M17-2640
CrossRef - PubMed - Ketteler M, Evenepoel P, Holden RM, et al. Chronic kidney disease–mineral and bone disorder: conclusions from a Kidney Disease: Improving Global Outcomes (KDIGO) Controversies Conference. Kidney Int. 2025;107(3):405-423. doi:10.1016/j.kint.2024.11.013
CrossRef - PubMed - Velioglu A, Kaya B, Aykent B, Ozkan B, Karapinar MS, Arikan H, et al. Low bone density, vertebral fracture and FRAX score in kidney transplant recipients: a cross-sectional cohort study. PLoS One. 2021;16(4):e0251035. doi:10.1371/journal.pone.0251035
CrossRef - PubMed - Taweesedt PT, Disthabanchong S. Mineral and bone disorder after kidney transplantation. World J Transplant. 2015;5(4):231-242. doi:10.5500/wjt.v5.i4.231
CrossRef - PubMed - Neves CL, dos Reis LM, Batista DG, et al. Persistence of bone and mineral disorders 2 years after successful kidney transplantation. Transplantation. 2013;96(3):290-296. doi:10.1097/TP.0b013e3182985468
CrossRef - PubMed - Cannata-Andía JB, Martín-Carro B, Martín-Vírgala J, et al. Chronic kidney disease—mineral and bone disorders: pathogenesis and management. Calcif Tissue Int. 2021;108(4):410-422. doi:10.1007/s00223-020-00777-1
CrossRef - PubMed - Tran NN, My PV, Huyen NT, et al. Assessment of mineral and bone disorders in kidney transplant recipients at People’s Hospital 115. Tap Chi Y Hoc Thanh Pho Ho Chi Minh. 2025;28(12):76-84. doi:10.32895/hcjm.m.2025.12.10
CrossRef - PubMed:
- Keronen S, Martola L, Finne P, Burton IS, Kröger H, Honkanen E. Changes in bone histomorphometry after kidney transplantation. Clin J Am Soc Nephrol. 2019;14(6):894-903. doi:10.2215/CJN.09950818
CrossRef - PubMed - Torres A, Lorenzo V, Salido E. Calcium metabolism and skeletal problems after transplantation. J Am Soc Nephrol. 2002;13(2):551-558. doi:10.1681/ASN.V132551
CrossRef - PubMed - Wang C, Huo Y, Li X, et al. Factors related to bone metabolism in kidney transplant recipients. Mediators Inflamm. 2021;2021(1):6679095. doi:10.1155/2021/6679095
CrossRef - PubMed - Jørgensen HS, Behets G, Bammens B, Claes K, Meijers B, Naesens M, et al. Patterns of renal osteodystrophy 1 year after kidney transplantation. Nephrol Dial Transplant. 2021;36(11):2130-2139. doi:10.1093/ndt/gfab239
CrossRef - PubMed - Meng C, Jørgensen HS, Verlinden L, et al. Contemporary kidney transplantation has a limited impact on bone microarchitecture. Bone Rep. 2022;16:101172. doi:10.1016/j.bonr.2022.101172
CrossRef - PubMed - Heaf J, Tvedegaard E, Kanstrup IL, Fogh‐Andersen N. Bone loss after renal transplantation: role of hyperparathyroidism, acidosis, cyclosporine and systemic disease. Clin Transplant. 2000;14(5):457-463. doi:10.1034/j.1399-0012.2000.140503.x
CrossRef - PubMed - Mundy G, Garrett R, Harris S, et al. Stimulation of bone formation in vitro and in rodents by statins. Science. 1999;286(5446):1946-1949. doi:10.1126/science.286.5446.1946
CrossRef - PubMed - Li GH, Cheung CL, Au PC, Tan KC, Wong IC, Sham PC. Positive effects of low LDL-C and statins on bone mineral density: an integrated epidemiological observation analysis and Mendelian randomization study. Int J Epidemiol. 2020;49(4):1221-1235. doi:10.1093/ije/dyz145
CrossRef - PubMed - Malluche HH, Monier-Faugere M-C, Herberth J. Bone disease after renal transplantation. Nat Rev Nephrol. 2010;6(1):32-40. doi:10.1038/nrneph.2009.192
CrossRef - PubMed - Sun L, Wang Z, Zheng M, et al. Mineral and bone disorder after kidney transplantation: a single-center cohort study. Ren Fail. 2023;45(1):2210231. doi:10.1080/0886022X.2023.2210231
CrossRef - PubMed - Jørgensen HS, Behets G, Viaene L, et al. Diagnostic accuracy of noninvasive bone turnover markers in renal osteodystrophy. Am J Kidney Dis. 2022;79(5):667-676.e1. doi:10.1053/j.ajkd.2021.07.027
CrossRef - PubMed - Jørgensen HS, Claes K, Smout D, et al. Associations of changes in bone turnover markers with change in bone mineral density in kidney transplant patients. Clin J Am Soc Nephrol. 2024;19(4):483-493. doi:10.2215/CJN.0000000000000368
CrossRef - PubMed - Palmer SC, Chung EY, McGregor DO, Bachmann F, Strippoli GF. Interventions for preventing bone disease in kidney transplant recipients. Cochrane Database Syst Rev. 2019;10(10):CD005015. doi:10.1002/14651858.CD005015.pub4
CrossRef - PubMed

Volume : 24
Issue : 8
Pages : 589 - 599
DOI : 10.6002/ect.2026.0203
From the 1Department of Nephrology-Transplant Immunology, People’s Hospital 115, and the 2Faculty of Medical Technology, Van Lang University, Ho Chi Minh City, Vietnam
Acknowledgements: The authors have not received any funding or grants in support of the presented research or for the preparation of this work and have no declarations of potential conflicts of interest. The same cohort of 135 kidney transplant recipients was previously characterized for overall mineral and bone disorder prevalence in a separate descriptive study (Nguyen et al., Tap Chi Y Hoc Thanh Pho Ho Chi Minh. 2025;28(12):76-84; doi:10.32895/hcjm.m.2025.12.10). The present manuscript addresses distinct prespecified analytical objectives using multivariable regression methods not reported in the previous publication.
Author contributions: T. N. Nguyen provided conceptualization, data curation, formal investigation, patient recruitment, clinical data collection, and writing (review and editing). T. T. M. Than provided formal analysis, data processing, statistical software, methodology, visualization, and writing (original draft). U. T. P. Nguyen provided data processing, software, validation, formal analysis, and writing (review and editing). T. K. Lam provided conceptualization, methodology design, supervision, project administration, funding acquisition, writing (review and editing), and final approval.
Corresponding author: Thanh Kien Lam, Faculty of Medical Technology, Van Lang University, Ho Chi Minh City, Vietnam
E-mail: thanh.lk@vlu.edu.vn
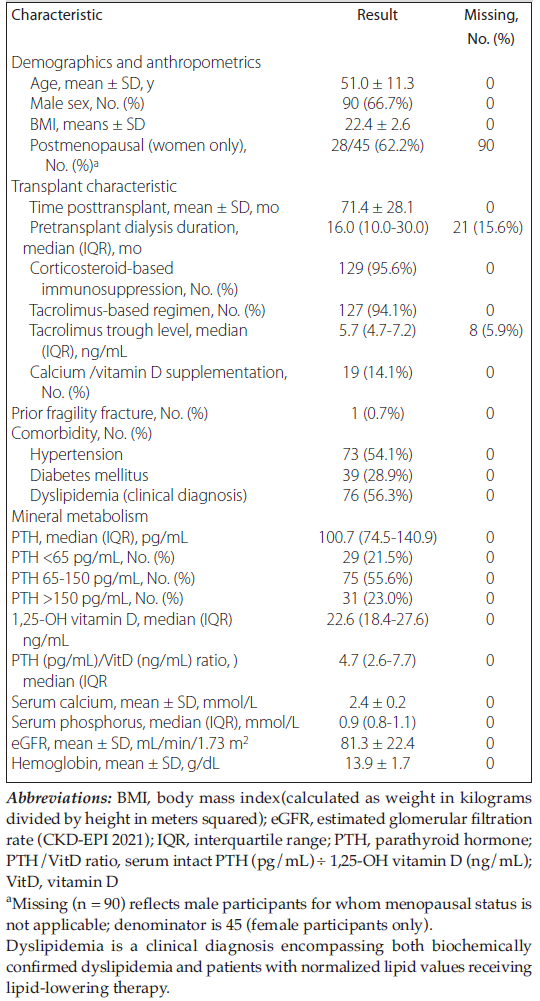
Table 1. Baseline Characteristics of Kidney Transplant Recipients (n = 135)
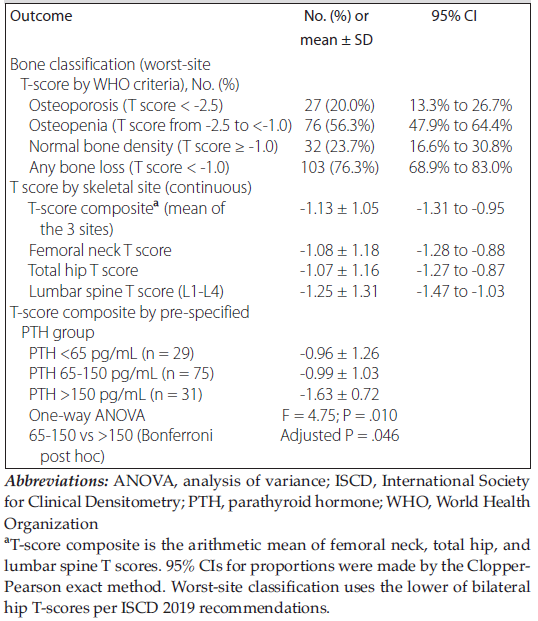
Table 2. Bone mineral density outcomes and T-score composite by PTH group (n = 135)
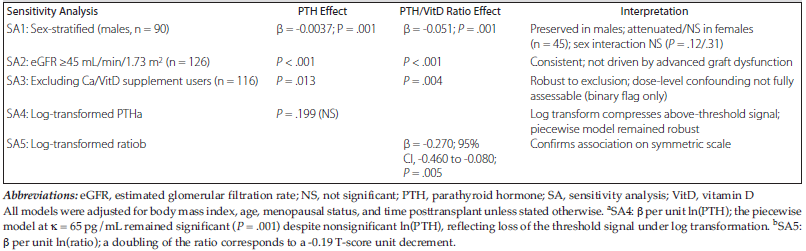
Table 3. Prespecified Sensitivity Analyses for Parathyroid Hormone Threshold and Association Between Ratio of Parathyroid Hormone to Vitamin D and T-Score Composite (n = 135)
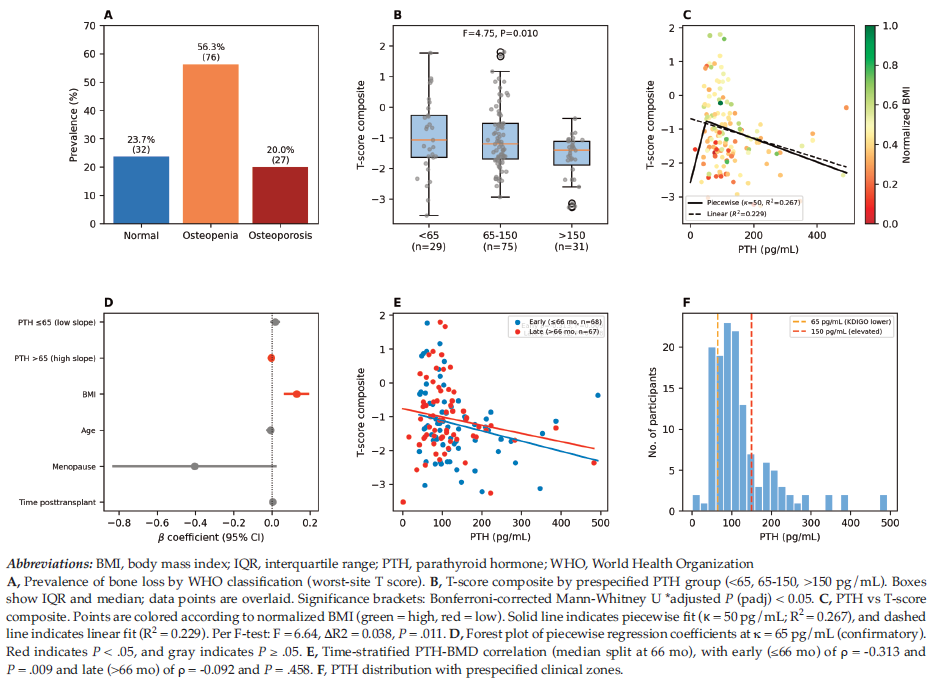
Figure 1. Nonlinear Association Between Parathyroid Hormone and Bone Mineral Density in Kidney Transplant Recipients (n = 135)
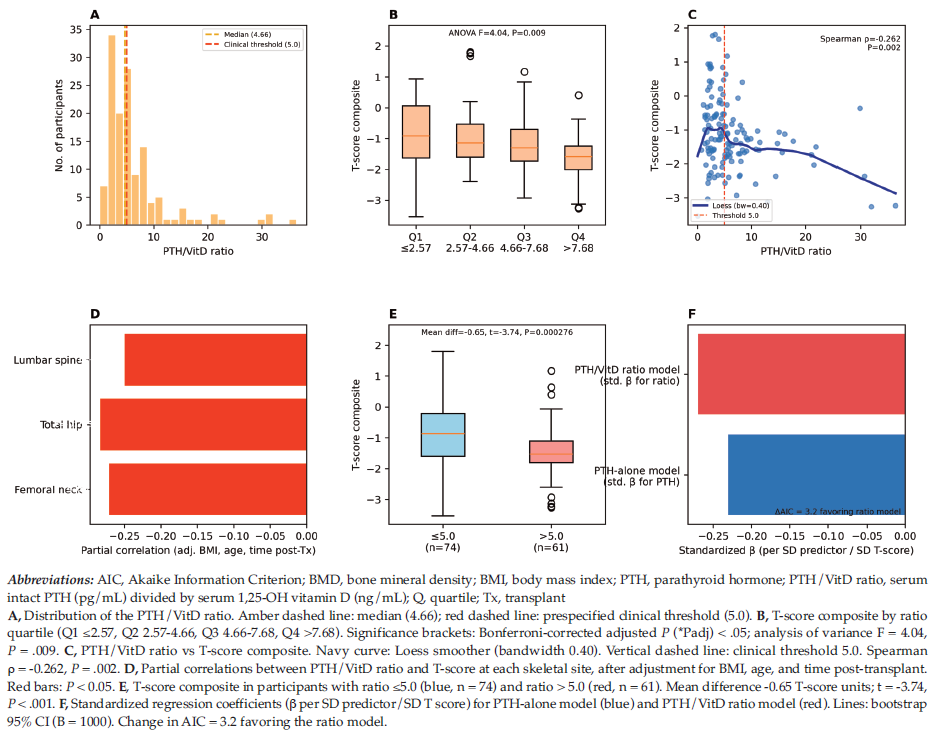
Figure 2. Ratio of Parathyroid Hormone to Vitamin D as an Integrated Predictor of Bone Mineral Density in Kidney Transplant Recipients (n = 135)