Volume: 24 Issue: 10 October 2026
FULL TEXT
Comparative Analysis of Glomerular Filtration Rate Assessment Methods in Kidney Transplant Recipients
Objectives: Accurate assessment of glomerular filtra-tion rate is crucial for clinical follow-up of kidney transplant recipients. We evaluated agreement and performance of 3 serum creatinine-based equations (MDRD, race-free CKD-EPI 2021, and EKFC) relative to a clinically available measured glomerular filtration rate comparator method based on 99mTc-DTPA plasma clearance.
Materials and Methods: In this single-center cross-sectional study, we evaluated 62 stable kidney transplant recipients (1-3 years posttransplant). Measured glomerular filtration rate was determined using the comparator method with a nuclear medicine slope-intercept technique and a 3-plasma sample method. We assessed equation performance using repeated-measures analysis of variance with Bonferroni-adjusted pairwise comparisons, correlation analysis, Bland-Altman mean bias and 95% limits of agreement, mean absolute error, and P30 accuracy across measured glomerular filtration rate, sex, age, and body mass index subgroups.
Results: Most recipients were male (n = 44, 71%), with mean age of 40.98 ± 11.46 years. Measured glomerular filtration rate (in mL/min/1.73 m2) was <60 in 50 recipients (low filtration) and ≥60 in 12 recipients (high filtration). In the low filtration subgroup, CKD-EPI 2021 and EKFC overestimated measured glomerular filtration rate obtained with the comparator method (mean bias -8.14 and -6.80 mL/min/1.73 m2), whereas MDRD showed the smallest absolute mean bias (-1.63 mL/min/1.73 m2) and the highest P30 accuracy (90.0%). In the high filtration subgroup, EKFC showed a near-zero mean bias (-0.27 mL/min/1.73 m2). However, 95% limits of agreement remained wide, with limited interpretation because of small subgroup size. In recipients with obesity, all equations showed higher mean absolute error and substantial interindividual variability.
Conclusions: Among serum creatinine-based equations, MDRD showed the closest agreement with the 99mTc-DTPA comparator method, particularly in the low filtration subgroup; EKFC findings in the high filtration subgroup required cautious interpretation. Multi-center studies, ideally including cystatin C-based and combined creatinine-cystatin C equations, are needed for further validation.
Key words : CKD-EPI 2021, EKFC, Kidney allograft function, MDRD, Technetium Tc 99m DTPA
Introduction
Kidney transplantation (KT) remains the preferred treatment modality for patients with end-stage renal disease, offering better survival, improved quality of life, and reduced health care costs compared with other modalities of renal replacement therapy (RRT).1-3
Follow-up of KT recipients (KTRs) involves several parameters to assess allograft function and remains a challenge in clinical practice and research. Among parameters, glomerular filtration rate (GFR) is considered to be one of the most important and frequently used indicators of overall kidney function.2 This measurement is also a key predictor of long-term graft survival and serves as an independent risk factor for cardiovascular mortality, which remains the leading cause of death among KTRs.3
Of note, in KTRs, as well as in the general population with chronic kidney disease (CKD) not on RRT, the prevalence of complications (hypertension, anemia, and mineral and bone disorders) associated with reduced kidney function increases significantly as GFR decreases.4 Therefore, an accurate assessment of GFR is crucial for the treatment and follow-up of these patients. According to Kidney Disease: Improving Global Outcomes (KDIGO) guidelines, calculation of estimated GFR (eGFR) using serum creatinine (sCr) as an endogenous filtration marker is a standard initial approach. The use of exogenous filtration markers to determine measured GFR (mGFR) is recommended whenever a precise assessment of kidney function or detection of an early change in GFR is needed for treatment and management decisions.5
The accuracy of sCr as an endogenous indicator of kidney function is influenced by factors such as age, sex, race, muscle mass, and dietary protein intake.6 In addition, corticosteroid therapy, infection, rejection, and prolonged dialysis may alter sCr metabolism and secretion in KTRs.7,8
Furthermore, drugs such as trimethoprim can interfere with tubular creatinine secretion, causing sCr to rise transiently without a parallel reduction of GFR, leading to an underestimation of kidney function.9 In addition, mGFR may decrease signi-ficantly before changes in sCr are detected, delaying the recognition of graft dysfunction.8 Because non-GFR determinants of sCr are particularly relevant in KTRs, the performance of sCr-based eGFR equations should be evaluated against clinically available measured comparator methods in this population.6-8
Inulin has traditionally been considered as an ideal filtration marker and research reference method for determining mGFR. Inulin is freely filtered through the glomeruli with no tubular secretion or reabsorption and no plasma protein binding. However, the use of inulin measurement in everyday clinical practice is limited due to procedural complexity, time requirements, and high cost.10
In the absence of inulin and because of limited availability of other exogenous markers such as iothalamate, iohexol, and 51Cr-EDTA, technetium-99m diethylenetriaminepentaacetic acid (99mTc-DTPA) may be used as a practical nuclear medicine method for mGFR assessment.11 Vidal-Petiot and colleagues reported excellent accuracy and precision of 99mTc-DTPA clearance compared with 51Cr-EDTA clearance, with a small systematic overestimation of approximately 2 mL/min, supporting 99mTc-DTPA as a reliable alternative radiopharmaceutical for GFR assessment.12
Measured GFR may be obtained with the use of single- or multi-sample plasma clearance protocols after intravenous administration of an exogenous tracer. From these plasma samples, a plasma disappearance curve is generated, and GFR is determined from the ratio of the injected activity to the area under the curve.11,12 In the present study, mGFR was determined using a nuclear medicine slope-intercept technique with a 3-plasma sample method (TPSM) after administration of 99mTc-DTPA. This TPSM/99mTc-DTPA approach was used as a clinically available comparator method for evaluation of sCr-based eGFR equations, rather than as a gold-standard reference method. Several sCr-based equations for estimation of GFR have been evaluated in KTRs, including the Modification of Diet in Renal Disease (MDRD),13 the Chronic Kidney Disease Epidemiology Collaboration (CKD-EPI 2021),14 the European Kidney Function Consortium (EKFC),15 the Cockcroft-Gault equation, and the Nankivell equation. In the present study, we focused on the first 3 equations, as they are normalized to body surface area (BSA) and reported in mL/min/1.73 m2, allowing direct comparison with mGFR normalized to 1.73 m2.16 Our aim was to compare the agreement and performance of CKD-EPI 2021, MDRD, and EKFC sCr-based eGFR equations relative to the TPSM/99mTc-DTPA comparator method in stable KTRs.13-16
Materials and Methods
In this cross-sectional study, we compared different methods for GFR assessment in 62 adult KTRs at 1 to 3 years after KT. The study was conducted at the University Clinic of Nephrology and Institute of Nuclear Medicine (Skopje, North Macedonia), after approval by the Ethics Committee of the Faculty of Medicine (number 03-525/15, dated February 8, 2024) and in accordance with the ethical principles of the 1975 Declaration of Helsinki and its later amendments. Written informed consent was obtained from all participants before inclusion in the study.
The cohort included 30 deceased donor and 32 living donor KTRs. All transplant procedures were performed strictly in accordance with national legal and ethical frameworks. In the subgroup of living donor KTRs, the eligible donor-recipient relationships were documented according to national legislation. All living donors were adults and had provided written informed consent before donation. Living donor relationships were as follows: mother (n = 13), father (n = 9), spouse (n = 4), brother (n = 2), sister (n = 3), and aunt (n = 1). All living donors were biologically related to the recipients or were their spouses.
Inclusion criteria were stable graft function at 1 to 3 years after KT, with no clinical signs of acute infection, acute graft rejection, immunosuppressive drug-related nephrotoxicity, or active malignancy at the time of mGFR assessment. We excluded patients with edema, extracellular volume excess, pleural effusions, and ascites.
Measured GFR was assessed in all participants using the nuclear medicine slope-intercept technique with TPSM after administration of 99mTc-DTPA. We used TPSM/99mTc-DTPA as the clinically available comparator method for the evaluation of sCr-based equations CKD-EPI 2021, EKFC, and MDRD.
Clinical and transplant-related variables
We extracted additional clinical and transplant-related variables from the electronic database and medical records, including donor type, donor age, duration and modality of RRT before KT, time from KT to mGFR assessment, maintenance immunosuppressive regimen, and 24-hour proteinuria (mg/24 hours). For deceased donors, donor age was defined as age on the day of death, whereas for living donors, donor age was defined as age on the day of kidney donation. The maintenance immunosuppressive regimen was summarized according to calcineurin inhibitor (CNI) type, mycophenolic acid-based antimetabolite therapy, and corticosteroid use.
Protocol kidney allograft biopsies were not routinely performed in our center, and biopsies were performed only when clinically indicated. Therefore, previous biopsy-proven rejection and biopsy-proven BK virus nephropathy could not be systematically assessed in all recipients and were not included as formal variables in the comparative analysis. BK virus polymerase chain reaction was negative in all recipients at the time of mGFR assessment.
Calculation of measured glomerular filtration rate using 3-plasma sample method with 99mTc-DTPA in kidney transplant recipients Participants were hydrated with oral water intake of approximately 10 mL/kg body weight about 30 minutes before tracer administration, according to the published nuclear medicine guidance and the institutional protocol by Peshevska and colleagues.17,18 After intravenous administration of 99mTc-DTPA, venous blood samples (5 mL) were collected from the opposite arm at 120, 180, and 240 minutes into heparinized tubes to avoid contamination and maintain sample purity. Samples were centrifuged at 1000 revolutions/minute for 10 minutes, and 1 mL of plasma was transferred from each sample. A standard was prepared simultaneously.
The administered activity of 99mTc-DTPA in adult KTRs ranged from 37 to 54 MBq, according to the institutional protocol of the Institute of Nuclear Medicine.17,18 Immediately before injection, the required activity (±10%) was drawn into a syringe, diluted with saline to a total volume of 1 mL, and measured in a dose calibrator. The tracer was then administered intravenously, and the exact injection time was recorded. Kidney transplant recipients with paravenous administration of radiotracer were excluded due to invalid measurements.
After injection, the empty syringe was remea-sured in the dose calibrator to determine residual activity, and all measurements were decay-corrected to the time of injection. A manual well-type gamma counter (Hidex Triathler Gamma Counter, model 425-024) was used to measure plasma sample activity (expressed as counts per minute). Relative activity was converted to tracer concentration in plasma (calculated as percentage of injected dose per liter [%/L]). We calculated mGFR using the slope-intercept method,18 normalized to BSA,16 and corrected for the omitted early-phase component using the Brøchner-Mortensen correction.19
Calculation of estimated glomerular filtration rate using creatinine-based equations
A routine blood sample (5 mL) was collected for sCr determination. Serum creatinine (reported in μmol/L20) was measured on Beckman Coulter AU/DxC AU analyzers, which used a compensated kinetic Jaffe method traceable to the isotope dilution mass spectrometry-reference method (NIST SRM 967).
To calculate eGFR (mL/min/1.73 m2), the following sCr equations were used: MDRD,13 the race‑free CKD‑EPI 2021,14 and the EKFC.15 The EKFC equation adjusts sCr to an age, sex, and population‑specific Q value, which corresponds to the median sCr concentration in a healthy reference population, in order to minimize systematic differences in sCr generation across age and sex groups.15
Statistical analyses
We expressed continuous variables as means ± SD or as median (interquartile range), as appropriate, and categorical variables as number per total (%). We stratified the study population according to TPSM-derived mGFR into 2 subgroups: mGFR <60 and mGFR ≥60 mL/min/1.73 m2. We made exploratory comparisons of baseline, clinical, and transplant-related characteristics between mGFR subgroups using the Mann-Whitney U test for continuous variables and the Fisher exact test for binary categorical variables.
We compared mean GFR values obtained using the TPSM comparator method and estimated using the CKD-EPI 2021, MDRD, and EKFC equations with repeated-measures analysis of variance (ANOVA) followed by Bonferroni-adjusted pairwise comparisons. Associations were assessed with Pearson correlation. We evaluated agreement with Bland-Altman analysis. We calculated mean bias as Δ = TPSM-derived mGFR – eGFR, with negative values indicating that the equation overestimates relative to the TPSM comparator method. We reported mean bias, 95% CI, and 95% limits of agreement (LoA), which were calculated as mean bias ± 1.96 SD of paired differences.
We quantified accuracy using P30, defined as the percentage of eGFR values within ±30% of TPSM-derived mGFR, and mean absolute error (MAE). We summarized performance metrics for the overall cohort and for predefined clinical subgroups according to mGFR category, sex, age, and body mass index (BMI). Because of the limited sample size, particularly in the mGFR ≥60 mL/min/1.73 m2 subgroup, all subgroup analyses were considered exploratory. We conducted a descriptive post hoc power calculation, based on paired effect sizes, for the mGFR ≥60 mL/min/1.73 m2 subgroup to further characterize the potential for type II error. We did not conduct multivariable adjusted analyses and formal equation performance subgroup analyses according to transplant-related variables because of limited cohort size and small subgroup counts. We used the online statistical software Statisty (https://statisty.app/), with additional calculations verified in Python, to perform analyses. We prepared figures in Microsoft Excel. A 2-sided P < .05 was considered statistically significant.
Results
Our cohort included 62 KTRs who received a kidney transplant from either a living or a deceased donor. Forty-four recipients were male (71%), and the mean age of the study cohort was 40.98 ± 11.46 years (range, 18-66 years). Thirty-two KTRs (51.6%) received a kidney from a living donor, whereas 30 (48.4%) received a kidney from a deceased donor. Baseline, clinical, and transplant-related characteristics of the study population are summarized in Table 1.
Based on TPSM-derived mGFR, the study popu-lation was stratified into 2 subgroups: mGFR <60 mL/min/1.73 m2 (n = 50) and ≥60 mL/min/1.73 m2 (n = 12). Correlation and comparative analyses were conducted in both subgroups to evaluate the relationship between TPSM-derived mGFR and the eGFR values calculated using the CKD-EPI 2021, MDRD, and EKFC equations. In exploratory between-group comparisons of characteristics shown in Table 1, donor age and sCr were significantly lower in the mGFR ≥60 mL/min/1.73 m2 subgroup (P < .001 for both). No significant differences were observed between the mGFR subgroups for recipient age, sex, BMI, BSA, donor type, time on RRT before KT, time from KT to mGFR assessment, maintenance CNI type, or proteinuria.
Table 2 summarizes TPSM-derived mGFR values and eGFR values calculated using the CKD-EPI 2021, MDRD, and EKFC equations in both mGFR subgroups. Repeated-measures ANOVA followed by Bonferroni-adjusted pairwise comparisons de-monstrated that, in the mGFR <60 mL/min/1.73 m2 subgroup, CKD-EPI 2021 and EKFC differed significantly from TPSM-derived mGFR, whereas MDRD did not. In the mGFR ≥60 mL/min/1.73 m2 subgroup, no significant paired differences were observed between TPSM-derived mGFR and any of the 3 eGFR equations (Table 3).
Because the mGFR ≥60 mL/min/1.73 m2 sub-group included only 12 KTRs, an observed post hoc power analysis was performed to further charac-terize the potential for type II error in this subgroup. Observed power for the paired differences was 49.1% for CKD-EPI 2021, 67.6% for MDRD, and 5.1% for EKFC, corresponding to β estimates of 50.9%, 32.4%, and 94.9%, respectively. These observed power estimates were interpreted descriptively.
Significant positive correlations were observed between TPSM-derived mGFR and all 3 eGFR equations in both mGFR subgroups (Figure 1).
Figure 2 shows results of Bland-Altman analysis, which characterized agreement between TPSM-derived mGFR and the eGFR equations across both mGFR subgroups. In the mGFR <60 mL/min/1.73 m2 subgroup, CKD‑EPI 2021 and EKFC showed negative mean bias (overestimation relative to TPSM-derived mGFR), whereas MDRD showed the smallest absolute mean bias. In the mGFR ≥60 mL/min/1.73 m2 subgroup, CKD-EPI 2021 and MDRD showed mean bias in opposite directions, and EKFC demonstrated near‑zero mean bias. However, the 95% LoA remained wide across equations.
Table 4 summarizes mean bias (Δ = TPSM-derived mGFR − eGFR) with 95% CI, numerical 95% LoA, MAE, and P30 accuracy for CKD-EPI 2021, MDRD, and EKFC relative to TPSM across the overall cohort and predefined clinical subgroups according to mGFR category, sex, age, and BMI.
Discussion
Our study evaluated the diagnostic performance of sCr‑based eGFR equations relative to a clinically available TPSM/99mTc-DTPA comparator method in KTRs. The results demonstrated range‑dependent agreement across equations (Table 4). Overall, MDRD showed the smallest absolute mean bias and the numerically narrowest LoA among the 3 equations. However, this overall finding should be interpreted in the context of our cohort structure because most KTRs had mGFR <60 mL/min/1.73 m2. In this low mGFR subgroup, MDRD showed the closest agreement with the TPSM comparator method, whereas CKD-EPI 2021 and EKFC tended to overestimate TPSM-derived mGFR. From a clinical point of view, this is relevant because graft function in KTRs most often ranges between 40 and 60 mL/min/1.73 m2 due to single-graft physiology, donor and peritransplant factors, chronic allograft injury, and CNI-related nephrotoxicity.21,22 In this range, MDRD, which was originally developed in CKD cohorts, may demonstrate more favorable agreement than equations optimized for broader or higher GFR ranges.21,22 Still, these findings should not be interpreted as evidence of general superiority of MDRD across the full spectrum of graft function.
The KDIGO guidelines support the routine use of validated eGFR equations in clinical practice, whereas mGFR assessment using exogenous filtration markers may be considered when greater precision is required for clinical decision-making.5,23 Evidence from the general population has shown that MDRD may underestimate GFR at higher levels of kidney function, supporting broader use of CKD‑EPI-type equations for routine follow-up.14,24
In KTRs, however, equation performance is less consistent and may vary according to graft function range and cohort characteristics.22,25 Therefore, the more favorable MDRD findings in our cohort likely reflect, at least in part, the predominance of KTRs with reduced graft function rather than universal superiority of this equation.
In the small-size mGFR ≥60 mL/min/1.73 m2 subgroup, however, EKFC showed near-zero mean bias, suggesting close average agreement with TPSM-derived mGFR. This could be partially explained by the EKFC concept of adjusting the sCr to age, sex, and population‑specific Q values, validated in large European cohorts that included individuals with preserved kidney function.15 However, with only 12 KTRs in this subgroup, the stability and precision of subgroup estimates were reduced, increasing the potential for type II error. Consequently, the EKFC finding should be interpreted tentatively and considered hypothesis-generating rather than evidence of equivalent performance at higher GFR levels.
In this regard, Bland-Altman analysis (Figure 2), together with the numerical 95% LoA presented in Table 4, emphasized that acceptable mean bias at the group level does not necessarily mean reliable agreement for individual patients. Although MDRD had the smallest absolute mean bias in the overall cohort and EKFC showed near-zero mean bias in the high mGFR subgroup, the LoA remained wide, indicating relevant interindividual variability. This is clinically important because decisions in KTRs are made at the individual-patient level, including interpretation of graft function changes, follow-up intensity, drug dosing, and decisions on further diagnostic evaluation. Therefore, equation perfor-mance should not be interpreted only on the basis of mean bias or P30 accuracy.
The modest overestimation observed with CKD‑EPI 2021 in several subgroups may be related to the latest race-free modification. The original CKD-EPI 2009 equation was designed to perform similarly to MDRD at GFR <60 mL/min/1.73 m2, while improving accuracy at higher GFR levels.24 In this regard, Hundemer and colleagues highlighted that removal of the race coefficient alone does not resolve the limitations of sCr-based estimation in KTRs.26 In addition, the EKFC sCr equation has been proposed as an alternative race‑free equation that has been evaluated in a European KTR cohort using inulin-measured GFR.27 In that study, EKFC showed comparable performance to MDRD and the CKD‑EPI 2009 equation, with more favorable accuracy metrics than CKD‑EPI 2021.27 This is broadly consistent with our observation that EKFC tended to overestimate TPSM-derived mGFR less than CKD-EPI 2021 in several subgroups. Nevertheless, in our cohort, EKFC did not consistently show more favorable metrics than MDRD, particularly in the larger-size subgroup with low mGFR range.
The variability of sCr-based equation performance in KTRs has been reported previously. In their review, White and colleagues described wide variability in the accuracy and bias of MDRD, with studies in KTRs showing ranges from underestimation to overestimation.25 Such heterogeneity may be related to differences in cohort size and composition, variability in sCr assay measurements, which may be influenced by nonspecific interferences,20 radiotracer selection, and methodological variations in mGFR determination. In our study, sCr was measured using an isotope dilution mass spectrometry-traceable compensated kinetic Jaffe assay, which supports comparisons with sCr-based eGFR equations. Exogenous clearance techniques, including 99mTc-DTPA plasma clearance, may be affected by procedural factors such as pipetting, sample timing, standard preparation, and injection application issues. Therefore, strict quality-control mechanisms are necessary to provide reliable mGFR measurements. These procedures are typically implemented by the preparation and use of appropriate controls and standards.18,28
A further methodological limitation of the TPSM/99mTc-DTPA comparator method used in this study is that 99mTc-DTPA has a low degree of plasma protein binding (<5%) and minor tubular excretion. These characteristics may contribute to underes-timation of absolute GFR by up to approximately 8% compared with inulin-based measurements.29 However, comparative data with 51Cr-EDTA plasma clearance support the use of 99mTc-DTPA as a practical alternative radiopharmaceutical for mGFR assessment when other exogenous markers are not routinely available.12
When performance of equations was analyzed by sex (Table 4), both race-free equations tended to overestimate TPSM-derived mGFR, particularly in men, whereas MDRD showed smaller bias. A similar sex-related pattern has been reported in a European KTR cohort that used inulin-measured GFR, although direct comparison with our results is limited by the different mGFR comparator method.27
This overestimation in men may be related to differences between expected sCr generation in equation-development populations and the altered body composition often observed in male KTRs, including reduced muscle mass, which may lead to lower sCr generation.30 The EKFC equation showed less overestimation than CKD-EPI 2021, possibly due to the previously mentioned Q value adjustment,15 but MDRD remained closest to the TPSM comparator method in men. In women, MDRD showed slight underestimation, whereas both race-free equations still tended to overestimate TPSM-derived mGFR. A similar pattern was also noted by Bosma and colleagues,31 whereas Buron and colleagues22 reported comparable MDRD bias for both sexes. Because women represented only 29% of the cohort, sex-specific findings should be interpreted cautiously.
Analysis across age subgroups of <40 years and ≥40 years (Table 4) showed relatively stable performance with MDRD in both age categories, with the smallest absolute mean bias and the most favorable accuracy metrics. The EKFC equation showed lower overestimation than CKD-EPI 2021, particularly in KTRs aged <40 years, but its performance remained less favorable than MDRD in our cohort. These findings are comparable with Delanaye and colleagues, who reported that, in a European KTR cohort with inulin-measured GFR, EKFC performed more favorably than CKD‑EPI 2021 and showed performance comparable to MDRD.27 Because our cohort was relatively young and older recipients were underrepresented, these age-stratified findings may not be fully applicable to older KTRs.
When BMI was analyzed (Table 4), equation performance varied across BMI categories (normal, overweight, and obese). In normal weight and overweight KTRs, MDRD showed more favorable accuracy metrics, whereas CKD-EPI 2021 and EKFC generally tended to overestimate TPSM-derived mGFR. In KTRs with obesity (n = 13), all 3 equations showed higher MAE values and particularly wide LoA. In KTRs with obesity, P30 was identical across equations, and no equation showed clearly superior performance. These small subgroup findings limited firm conclusions, particularly near clinical decision thresholds. Because the Q value for EKFC is not BMI-specific, this factor should not be interpreted as direct correction for obesity-related differences in sCr generation.15
The overestimation observed with CKD-EPI 2021 and EKFC in several subgroups highlights the limitations of sCr-based GFR estimation in KTRs. After KT, sCr levels may be influenced by changes in tubular transport activity,32 reduced nephron mass, body composition changes, and effects of immuno-suppression therapy. These non-GFR determinants may increase the discrepancy between sCr-based eGFR and TPSM-derived mGFR.
Limitations
Our study had some limitations. First, our study focused solely on sCr-based equations. Cystatin C-based and combined creatinine-cystatin C equa-tions have been proposed as alternative approaches. Cystatin C was not routinely available in our cohort; therefore, these equations could not be evaluated.
In addition, this marker may also be influenced by its own non-GFR determinants (corticosteroids, immunosuppression, inflammation, tubular injury, metabolic and thyroid abnormalities), limiting its role in KTRs.14,33
Several transplant-related factors may influence the agreement between eGFR equations and the TPSM comparator method. As shown in Table 1, available variables, including donor type, donor age, time on RRT before KT, time from KT to mGFR assessment, maintenance immunosuppressive regimen, and proteinuria, were summarized descriptively. Donor age was lower in the mGFR ≥60 mL/min/1.73 m2 subgroup and may represent a donor-related factor associated with more favorable graft function. However, because of the limited cohort size and the small number of KTRs in this subgroup, reliable multivariable adjustment was not performed, and residual confounding by transplant-related factors cannot be excluded. BK virus polymerase chain reaction was negative in all recipients at the time of mGFR assessment, and protocol allograft biopsies were not routinely performed. Therefore, history of biopsy-proven rejection and biopsy-proven BK virus nephropathy could not be systematically evaluated as potential confounders.
Finally, our study had a single-center cross-sectional design with a relatively small sample size and uneven distribution across mGFR categories. The sample size reflects the single-center setting and the limited number of eligible stable KTRs assessed with standardized TPSM/99mTc-DTPA during the study period. Selected transplant-related variables were extracted from electronic records and medical files. Data on previous biopsy-proven acute rejection and biopsy-proven BK virus nephropathy were not systematically available. Larger prospective multic-enter studies, preferably through national or regional collaboration and ideally including cystatin C-based and combined creatinine-cystatin C equations, are needed to validate these findings across the full spectrum of graft function.
Conclusions
In this single-center cross-sectional study, MDRD demonstrated the closest agreement with the TPSM/99mTc-DTPA comparator method, particularly in KTRs with mGFR <60 mL/min/1.73 m2. Both CKD-EPI 2021 and EKFC tended to overestimate TPSM-derived mGFR in the lower GFR range. In the small subgroup of KTRs with mGFR ≥60 mL/min/1.73 m2, EKFC showed near-zero mean bias. However, with the wide LoA and limited subgroup size, cautious interpretation is needed. These findings suggest that sCr-based eGFR equations should be interpreted according to graft function range and clinical context, rather than with the assumption of universal superiority of a single equation. Larger multicenter studies, including cystatin C-based and combined equations, are needed for further validation in KTRs.
References:
- Suthanthiran M, Strom TB. Renal transplantation. N Engl J Med. 1994;331(6):365-376. doi:10.1056/NEJM199408113310606
CrossRef - PubMed - Levey AS, Eckardt KU, Tsukamoto Y, et al. Definition and classification of chronic kidney disease: a position statement from Kidney Disease: Improving Global Outcomes (KDIGO). Kidney Int. 2005;67(6):2089-2100. doi:10.1111/j.1523-1755.2005.00365.x
CrossRef - PubMed - Ojo AO. Cardiovascular complications after renal transplantation and their prevention. Transplantation. 2006;82(5):603-611. doi:10.1097/01.tp.0000235527.81917.fe
CrossRef - PubMed - Karthikeyan V, Karpinski J, Nair RC, Knoll G. The burden of chronic kidney disease in renal transplant recipients. Am J Transplant. 2004;4(2):262-269. doi:10.1046/j.1600-6143.2003.00315.x
CrossRef - PubMed - Kidney Disease: Improving Global Outcomes. KDIGO 2024 Clinical Practice Guideline for the Evaluation and Management of Chronic Kidney Disease. Kidney Int. 2024;105(4S):S117-S314. doi:10.1016/j.kint.2023.10.018
CrossRef - PubMed - Perrone RD, Madias NE, Levey AS. Serum creatinine as an index of renal function: new insights into old concepts. Clin Chem. 1992;38(10):1933-1953.
CrossRef - PubMed - Horber FF, Scheidegger J, Frey FJ. Overestimation of renal function in glucocorticosteroid treated patients. Eur J Clin Pharmacol. 1985;28(5):537-541. doi:10.1007/BF00544064
CrossRef - PubMed - Nankivell BJ, Gruenewald SM, Allen RD, Chapman JR. Predicting glomerular filtration rate after kidney transplantation. Transplantation. 1995;59(12):1683-1689. doi:10.1097/00007890-199506270-00007
CrossRef - PubMed - Delanaye P, Mariat C, Cavalier E, Maillard N, Krzesinski JM, White CA. Trimethoprim, creatinine and creatinine-based equations. Nephron Clin Pract. 2011;119(3):c187-193; discussion c193-184. doi:10.1159/000328911
CrossRef - PubMed - Inker LA, Levey AS. Measurement and estimation of kidney function. In: Himmelfarb J, Ikizler TA, eds. Chronic Kidney Disease, Dialysis, and Transplantation. 4th ed. Elsevier; 2019:23-41.
CrossRef - PubMed - Fleming JS, Zivanovic MA, Blake GM, Burniston M, Cosgriff PS; British Nuclear Medicine Society. Guidelines for the measurement of glomerular filtration rate using plasma sampling. Nucl Med Commun. 2004;25(8):759-769. doi:10.1097/01.mnm.0000136715.71820.4a
CrossRef - PubMed - Vidal-Petiot E, Courbebaisse M, Livrozet M, et al. Comparison of (51)Cr-EDTA and (99m)Tc-DTPA for glomerular filtration rate measurement. J Nephrol. 2021;34(3):729-737. doi:10.1007/s40620-020-00932-9
CrossRef - PubMed - Levey AS, Bosch JP, Lewis JB, Greene T, Rogers N, Roth D. A more accurate method to estimate glomerular filtration rate from serum creatinine: a new prediction equation. Modification of Diet in Renal Disease Study Group. Ann Intern Med. 1999;130(6):461-470. doi:10.7326/0003-4819-130-6-199903160-00002
CrossRef - PubMed - Inker LA, Eneanya ND, Coresh J, et al. New creatinine- and cystatin C-based equations to estimate GFR without race. N Engl J Med. 2021;385(19):1737-1749. doi:10.1056/NEJMoa2102953
CrossRef - PubMed - Pottel H, Bjork J, Courbebaisse M, et al. Development and validation of a modified full age spectrum creatinine-based equation to estimate glomerular filtration rate : a cross-sectional analysis of pooled data. Ann Intern Med. 2021;174(2):183-191. doi:10.7326/M20-4366
CrossRef - PubMed - Haycock GB, Schwartz GJ, Wisotsky DH. Geometric method for measuring body surface area: a height-weight formula validated in infants, children, and adults. J Pediatr. 1978;93(1):62-66. doi:10.1016/s0022-3476(78)80601-5
CrossRef - PubMed - European Association of Nuclear Medicine. Assessment of renal function and transit ([99mTc]Tc-DTPA). In: European Nuclear Medicine Guide. Chapter 7.1. Accessed April 28, 2026. https://nucmed-guide.app/chapter/214
CrossRef - PubMed - Peshevska A, Makazlieva T, Majstorov V, Barandovski L, Rambabova-Bushljetik I, Miladinova D. Comparative analysis of different nuclear medicine techniques in evaluation of renal function. Nucl Med Rev Cent East Eur. 2023;26(0):85-95. doi:10.5603/NMR.2023.0011
CrossRef - PubMed - Brochner-Mortensen J. A simple method for the determination of glomerular filtration rate. Scand J Clin Lab Invest. 1972;30(3):271-274. doi:10.3109/00365517209084290
CrossRef - PubMed - Bargnoux A-S, Kuster N, Cavalier E, et al. Serum creatinine: advantages and pitfalls. J Lab Precision Med. 2018;3. doi:10.21037/jlpm.2018.08.01
CrossRef - PubMed - Masson I, Flamant M, Maillard N, et al. MDRD versus CKD-EPI equation to estimate glomerular filtration rate in kidney transplant recipients. Transplantation. 2013;95(10):1211-1217. doi:10.1097/TP.0b013e318288caa6
CrossRef - PubMed - Buron F, Hadj-Aissa A, Dubourg L, et al. Estimating glomerular filtration rate in kidney transplant recipients: performance over time of four creatinine-based formulas. Transplantation. 2011;92(9):1005-1011. doi:10.1097/TP.0b013e3182301602
CrossRef - PubMed - Kidney Disease: Improving Global Outcomes Transplant Work Group. KDIGO clinical practice guideline for the care of kidney transplant recipients. Am J Transplant. 2009;9 Suppl 3:S1-155. doi:10.1111/j.1600-6143.2009.02834.x
CrossRef - PubMed - Levey AS, Stevens LA, Schmid CH, et al. A new equation to estimate glomerular filtration rate. Ann Intern Med. 2009;150(9):604-612. doi:10.7326/0003-4819-150-9-200905050-00006
CrossRef - PubMed - White CA, Huang D, Akbari A, Garland J, Knoll GA. Performance of creatinine-based estimates of GFR in kidney transplant recipients: a systematic review. Am J Kidney Dis. 2008;51(6):1005-1015. doi:10.1053/j.ajkd.2008.02.308
CrossRef - PubMed - Hundemer GL, White CA, Norman PA, et al. Performance of the 2021 race-free CKD-EPI creatinine- and cystatin C-based estimated GFR equations among kidney transplant recipients. Am J Kidney Dis. 2022;80(4):462-472 e461. doi:10.1053/j.ajkd.2022.03.014
CrossRef - PubMed - Delanaye P, Masson I, Maillard N, Pottel H, Mariat C. The New 2021 CKD-EPI equation without race in a European cohort of renal transplanted patients. Transplantation. 2022;106(12):2443-2447. doi:10.1097/TP.0000000000004234
CrossRef - PubMed - Bird NJ, Peters C, Michell AR, Peters AM. Using the slope-only technique and estimated glomerular filtration rate for checking the reliability of slope-intercept measurement of glomerular filtration rate. Nucl Med Commun. 2008;29(12):1086-1092. doi:10.1097/MNM.0b013e328310b378
CrossRef - PubMed - European Association of Nuclear Medicine. Dynamic renal imaging in obstructive renal pathology: a technologist’s guide. European Association of Nuclear Medicine; 2009. Accessed April 28, 2026. https://eanm.org/wp-content/uploads/2024/06/EANM_2009_tech_dynamic.pdf
CrossRef - PubMed - Delanaye P, Cavalier E, Pottel H. Serum creatinine: not so simple! Nephron. 2017;136(4):302-308. doi:10.1159/000469669
CrossRef - PubMed - Bosma RJ, Doorenbos CR, Stegeman CA, van der Heide JJ, Navis G. Predictive performance of renal function equations in renal transplant recipients: an analysis of patient factors in bias. Am J Transplant. 2005;5(9):2193-2203. doi:10.1111/j.1600-6143.2005.00982.x
CrossRef - PubMed - Maillard N, Mehdi M, Thibaudin L, Berthoux F, Alamartine E, Mariat C. Creatinine-based GFR predicting equations in renal transplantation: reassessing the tubular secretion effect. Nephrol Dial Transplant. 2010;25(9):3076-3082. doi:10.1093/ndt/gfq123
CrossRef - PubMed - Keddis MT, Amer H, Voskoboev N, Kremers WK, Rule AD, Lieske JC. Creatinine-based and cystatin C-based GFR estimating equations and their non-GFR determinants in kidney transplant recipients. Clin J Am Soc Nephrol. 2016;11(9):1640-1649. doi:10.2215/CJN.11741115
CrossRef - PubMed

Volume : 24
Issue : 10
Pages : 806 - 816
DOI : 10.6002/ect.2026.0116
From the 1University Clinic of Nephrology; the 2Institute of Pathophysiology and Nuclear Medicine; the 3University Clinic of Neurology; the 4University Clinic of Urology; and the 5Faculty of Medicine, University “Ss. Cyril and Methodius,” Skopje, North Macedonia
Acknowledgements: The authors express their gratitude to Violeta Tancevska, head nurse of the Kidney Transplantation Department, for exceptional organization and support in coordinating the patients included in this study. The authors have not received any funding or grants in support of the presented research or for the preparation of this work and have no declarations of potential conflicts of interest.
Corresponding author: Zhaklina Shterjova-Markovska, University Clinic of Nephrology, Vodnjanska No. 17, 1000 Skopje, North Macedonia
Phone: +389 78 319 103 E-mail:z.sterjova@yahoo.com
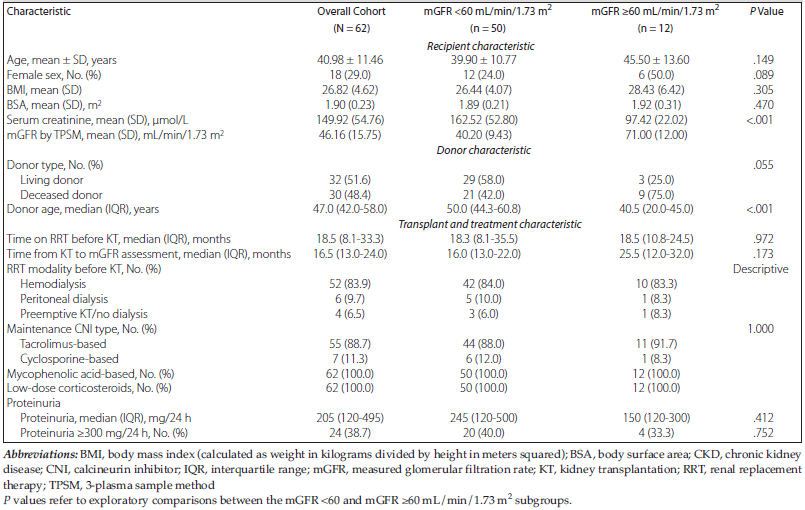
Table 1. Baseline, Clinical, and Transplant-Related Characteristics of the Study Cohort According to Measured Glomerular Filtration Rate Groups
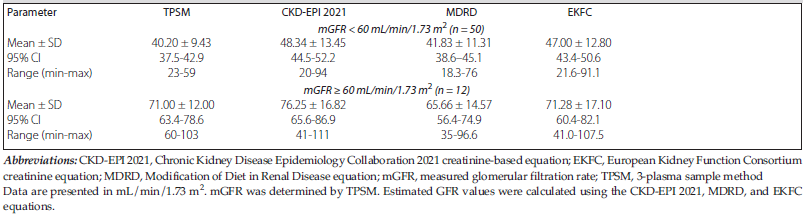
Table 2. Glomerular Filtration Rate Values by Assessment Method According to Measured Glomerular Filtration Rate Subgroup
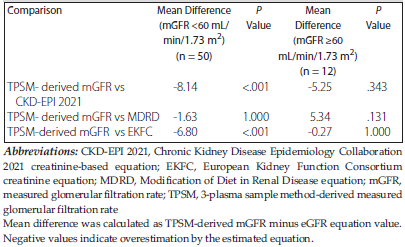
Table 3. Bonferroni-Adjusted Post Hoc Comparisons Versus Measured Glomerular Filtration Rate by Subgroup
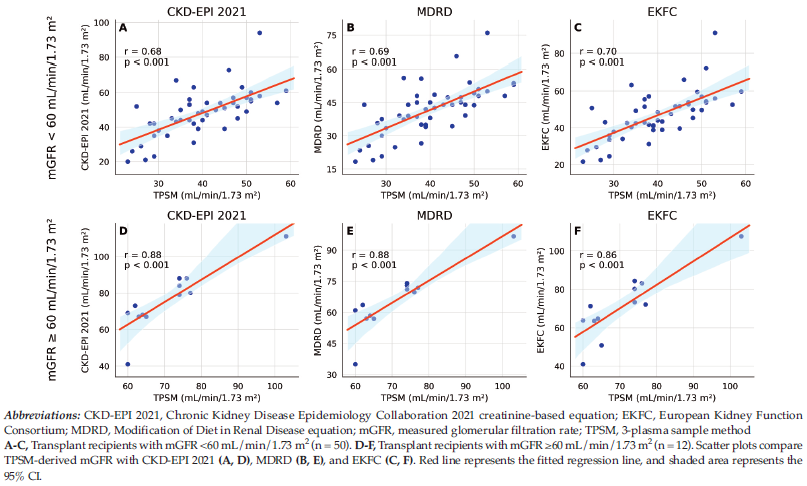
Figure 1. Correlation Between 3-Plasma Sample Method-Derived Measured Glomerular Filtration Rate and Creatinine-Based Estimated Glomerular Filtration Rate Equations According to Measured Glomerular Filtration Rate Subgroup
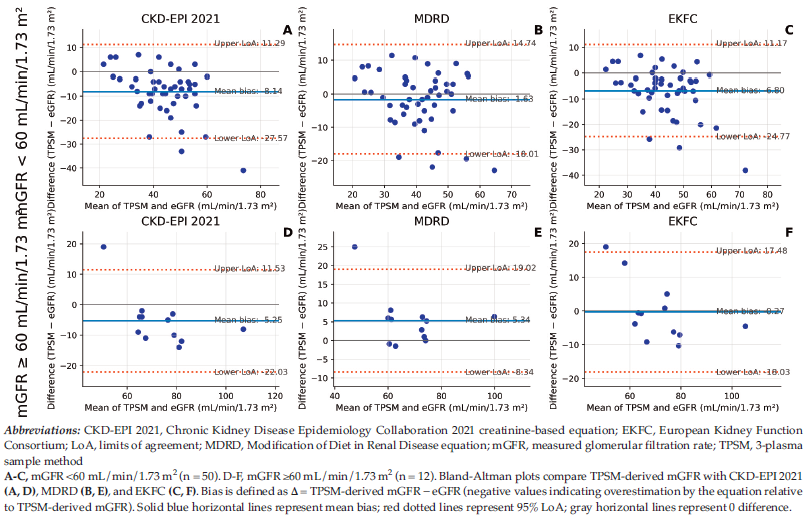
Figure 2. Bland-Altman Agreement Between 3-Plasma Sample Method-Derived Measured Glomerular Filtration Rate and Creatinine-Based Estimated Glomerular Filtration Rate Equations According to Measured Glomerular Filtration Rate Subgroup
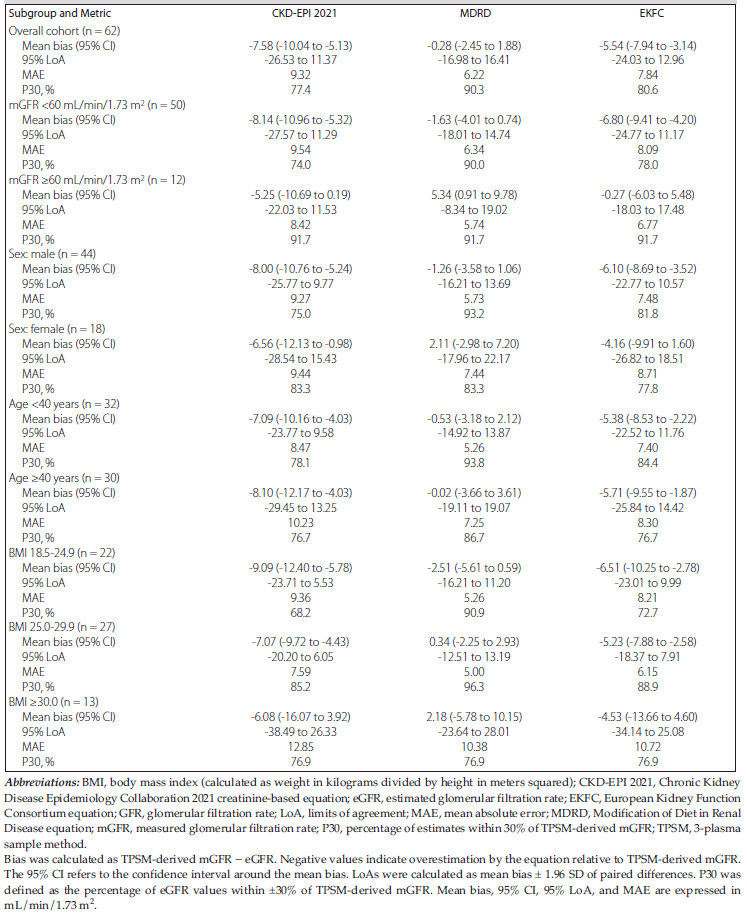
Table 4. Performance and Bland-Altman Agreement of Creatinine-Based Estimated Glomerular Filtration Rate Equations Across Clinical Subgroups