Volume: 22 Issue: 2 February 2024
FULL TEXT
Effect of Body Composition on Graft Function and Cardiovascular Outcomes in Normotensive Renal Transplant Recipients
Objectives: We evaluated the effects of body composition on graft function and cardiovascular outcomes in normotensive renal transplant recipients.
Materials and Methods: In this cross-sectional study, we analyzed ambulatory blood pressure monitoring data from 136 renal transplant recipients with stable allograft function after living related donor transplant. We enrolled 87 normotensive recipients. We analyzed left ventricular mass index, renal resistive index, and body composition of recipients. We divided recipients into 2 groups according to mean lean body mass, defined by bioimpedance analysis, with 38 in group 1 (lean body mass <47 kg) and 49 in group 2 (lean body mass ≥47 kg).
Results: Mean time posttransplant was 35.0 ± 23.3 months. Mean renal resistive index, left ventricular mass index, lean body mass, body mass index, and fat mass were 0.67 ± 0.1, 195.0 ± 118.5 g/m2, 47.3 ± 9.1 kg, 25.9 ± 5.0 kg, and 44.6 ± 10.5 kg, respectively. Lean body mass was positively correlated to sex (r = 0.36, P = .03), body mass index (r = 0.04, P = .416), renal resistive index (r = 0.495, P = .01), and left ventricular mass index
(r = 0.713, P = .02) but negatively correlated to serum albumin levels (r = -0.343, P = 0.04). Lean body mass was significantly higher in males than in females (P = .03). Patients in group 2 had significantly higher left ventricular mass index (P = .01) and renal resistive index (P = .03). In multiple regression analysis, lean body mass (P = .01) and left ventricular mass index (P = .01) were predictors of renal resistive index.
Conclusions: Lean body mass significantly influences left ventricular mass index and renal resistive index. Hence, body composition analysis could be an early predictor of graft function and cardiovascular outcomes in normotensive renal transplant recipients.
Key words : Ambulatory blood pressure monitoring, Body mass, Kidney transplantation, Normotension
Introduction
Chronic kidney disease (CKD) leads to abnormalities of nutritional status and body composition, especially among patients with advanced stages of disease. Although renal transplant is the best treatment option for patients with end-stage renal disease, renal transplant recipients (RTRs) may not reach the level of normal native kidney function because of several metabolic conditions, including new-onset diabetes mellitus, hyperlipidemia, and obesity. In RTRs, these conditions may lead to increased muscle protein catabolism and an altered proportion of fat and muscle mass compared with the general population, which can result in graft dysfunction and increased cardiovascular morbidity and mortality.1,2
The pathogenesis of cardiac disease in both CKD patients and in RTRs is complex and involves traditional and nontraditional risk factors.3 Hypertension is a major traditional risk factor for cardiovascular disease, which is the leading cause of premature death and a major factor in graft failure. Hypertension can increase left ventricular afterload and results in left ventricular hypertrophy (LVH) in RTRs.4
In the literature on graft function in RTRs, study populations are either hypertensive or are not catego-rized according to blood pressure measurements. To the best of our knowledge, this study will be the first to analyze the influence of body composition on graft function and cardiovascular outcomes in normotensive RTRs.
Materials and Methods
Study population
We cross-sectionally analyzed data from ambulatory blood pressure monitoring (ABPM) in 136 RTRs with stable allograft function after living related donor transplant who were seen in our renal transplant outpatient clinic. Among these, 87 RTRs were normotensive (<140 mm Hg in systolic and 80 mm Hg in diastolic without antihypertensive drugs). Recipients (46% males) had a mean age of 36.2 ± 1.8 years. Exclusion criteria were as follows: (1) patient incompliance or lack of regular follow-up data; (2) bone marrow transplant or other solid-organ transplant before or at the time of transplant (including previous kidney transplant); (3) history of malignant disease, rheumatologic or chronic inflammatory disease of unknown origin, or systemic vasculitis; (4) acute rejection periods after the first year posttransplant; (5) unstable cardiac disease, including heart failure (ejection fraction < 50%), and/or ischemic heart disease history (myocardial infarction, need for cardiac revascularization); (6) atrial fibrillation or elevated heart rate (>100 beats/min); (7) coronary bypass before or after transplant; (8) graft failure (glomerular filtration rate <30 mL/min); (9) patients with amputation or metal implants; and (10) patients who are planning to be or are pregnant.
The study protocol was approved by the local scientific ethics committee, and informed consent was obtained from all patients. We divided patients into 2 groups according to their mean lean body mass (LBM), as defined by bioimpedance analysis: group 1 had LBM of <47 kg (n = 38) and group 2 had LBM of ≥47 kg (n = 49).
Bioimpedance analysis
After measurement of body weight and height, body composition (fat mass, fat-free mass, muscle mass, and bone mass) was measured using the Tanita BC-420MA Body Composition Analyzer. Four electrodes were placed on the right hand and foot on the side contralateral to the arteriovenous fistula (if present) of the supine patient. Two electrodes were dorsally placed on the hand (in the metacar-pophalangeal articulations) and in the corpus, 5 cm apart. The electrode pair on the foot was located in the metatarsophalangeal and in the articulation, 6 cm apart. We determined LBM (in kg), fat mass (in kg), and body mass index (BMI; in kg/m2).
Analysis of biochemical parameters
We analyzed standard clinical (age, sex, duration of hemodialysis, posttransplant follow-up duration) and biochemical parameters. We examined results of patients’ physical examinations and routine laboratory measurements (complete blood count and biochemical parameters). All patients underwent collection of a venous blood sample after an overnight fast to measure levels of the following biochemical variables using standard laboratory techniques: fasting plasma glucose, creatinine, C-reactive protein, calcium, phosphorus, albumin, alkaline phosphatase, and lipids (total cholesterol, high-density lipoprotein cholesterol, triglycerides, low-density lipoprotein cholesterol; computed from Friedenwald’s formula).
We calculated the estimated glomerular filtration rate based on CKD-Epi formula: 141 × min(Scr/κ, 1)α × max(Scr/κ, 1)-1.209 × 0.993Age × 1.018 (if female) × 1.159 (if black), where Scr is serum creatinine, min(Scr/κ, 1) is the minimum of Scr/κ or 1.0, max(Scr/κ, 1) is the maximum of Scr/κ or 1.0, κ is 0.7 for females and 0.9 for males, and α is -0.329 for females and -0.411 for males.5
Ambulatory blood pressure monitoring
Ambulatory blood pressure monitoring was performed by using an overnight-automated ABPM monitor (Dyasis Integra II, Novacor). Blood pressure was measured in the contralateral arm to the arteriovenous fistula with appropriate cuff sizes for each patient. Routine ABPM was performed for 24 hours, and blood pressure was recorded and stored automatically every 15 minutes during awake hours and every 30 minutes during nocturnal hours. The ABPM device used the GARAPA (Gestio´n y Ana´lisis de Registros Ambulatorios de Presio´n Arterial) program, which we used to derive the average 24-hour systolic blood pressure (SBP) and diastolic blood pressure (DBP), the awake SBP and DBP, and the sleep SBP and DBP. We defined ABPM hypertension as daytime blood pressure of >135/85 mm Hg, nighttime blood pressure of >120/75 mm Hg, or 24-hour blood pressure of >130/80 mm Hg.6
Echocardiographic assessment
Echocardiographic studies were performed with the use of an Acuson machine (Aspen), equipped with 2.5- to 4.0-MHz micro-convex-array transducer. All patients were examined by means of 2-dimensional and M-mode echocardiography while on their left side, through the use of the parasternal long-axis sternal window. M-mode and 2-dimensional measurements were conducted according to recommendations from the American Society of Echocardiography.7 Ejection fraction was recorded as percentage. Left ventricular mass index (LVMI) was calculated by Devereux formula.8
Renal resistive index
Renal resistive index values were determined by examining the interlobar artery in the upper, middle, and lower zones of the kidney and by the average of 3 different measurements. For this, the Toshiba Aplio XG Doppler ultrasonography device was used together with a convex transducer (PVT-375BT). We calculated RRI by using the following formula: (peak systolic velocity − end-diastolic velocity)/peak systolic velocity.9
Statistical analyses
We used SPSS software version 15.0 (IBM) for statistical analyses. Numerical values with normal distribution are presented as mean ± SD. Data normality was analyzed by the Kolmogorov-Smirnov test. Variables with skew distribution are presented as median and interquartile range. Categorical variables are presented as percentages and were compared using the chi-square test. We compared normally distributed numeric variables with the independent-sample t test; we compared skewed distributed numeric variables with the Mann-Whitney U test. P < .05 was considered significant.
Results
General demographic characteristics of recipients are listed in (Table 1). The mean posttransplant time was 35.0 ± 23.3 months. Mean RRI, LBM, and BMI were 0.67 ± 0.1, 47.3 ± 9.1 kg, and 25.9 ± 5.0, respectively. Echocardiographic assessment showed mean LVMI of 195.0 ± 118.5 g/m2. Demographic, clinical, laboratory, and bioimpedance analysis of study groups are listed in (Table 2).
Our correlation analysis showed that LBM was positively correlated to recipient sex (r = 0.36, P = .03), BMI (r = 0.04, P = .416), RRI (r = 0.495, P = .01) (Figure 1), and LVMI (r = 0.713, P = 0.02) (Figure 2) but negatively correlated to serum albumin levels (r = -0.343, P = .04). Lean body mass was significantly higher in males than in females (48.0 ± 2.7 vs 34.8 ± 1.6 kg; P = .03).
In subgroup analysis, patients in group 2 had significantly higher LVMI (P = .01) (Figure 3) and RRI (P = .03) (Figure 4). In multiple regression analysis, LBM (95% CI, 0.03-0.011; P = .01) and LVMI (95% CI, 0.01-0.011; P = .01) were shown as predictors of RRI.
Discussion
Kidney transplant recipients can display altered body composition, which can lead to increased risk of cardiovascular disease, a leading cause of morbidity and mortality.10,11 The most prevalent cardiovascular risk factor is hypertension, which is associated with poor patient and graft survival.
Left ventricular hypertrophy increases the risk of myocardial infarction and stroke, as well as all-cause mortality, among both male and female patients with hypertension and in asymptomatic patients with normal blood pressure.12 In addition to hypertension, obesity, defined as BMI ≥30, is also related to LVH, in which body weight gain tends to increase blood pressure as a vicious circle.13 However, body composition and fat distribution cannot be adequately assessed by BMI; as obesity develops, both adipose and LBM increase. Recent studies reported that fat mass, visceral adipose tissue and ectopic fat distribution, such as pericardial fat were all related to LVM.14-16 Given these data, in the present study we evaluated normotensive and similar fat mass in RTRs to exclude the effects of blood pressure and fat distribution on LVH and detected a positive correlation between LBM and LVMI. Our data are in agreement with the work of Shea and colleagues,17 who evaluated nonhypertensive patients aged 4 to 21 years and showed that predicted LBM is the most accurate anthropometric scaling variable for left ventricular mass in LVH detection.
To our knowledge as first in the literature, one of the most important findings in our study is the relation between LBM and RRI measured within the stable kidney graft. The measurement of RRI by noninvasive Doppler ultrasonography can be used to evaluate integration of arterial compliance, pulsatility, peripheral resistance, and renal microcirculation.18 Renal resistive index is associated with long-term allograft and patient survival in RTRs.19 A recent study on RTRs, mostly hypertensive, detected that LVMI significantly influences the intrarenal vascular resistance.20 In a study of a pediatric population, Cilsal and colleagues reported that RRI measurements were independently associated with LVMI values.20 In our opinion, endothelial dysfunction, systemic inflammation, and arteriosclerotic lesions influence graft RRI values even in normotensive stable RTRs. In present study, we can explain the positive correlation between LBM and RRI by taking into account the potential role of renal vascular resistance on hemodynamic alteration of the cardiovascular system in which increased LBM resulted in left ventricle remodeling and increased RRI.
Apart from body composition parameters, the serum albumin level has long been recognized as a crude indicator of health and nutritional status.21 Albumin concentrations can also be modified by nonnutritional factors, such as the inflammatory state, capillary leak, hepatic disease, and altered hydration. In contrast to the common understanding of albumin, in our study, we detected a negative correlation between serum albumin and LBM values. As shown by Visser and colleagues, the reliability of serum albumin concentration as a biomarker is dependent on the type of population studied; a negative correlation can reflect the effects in some patients of underlying chronic inflammatory conditions that were not accounted for in their ascertainment of morbidity.22 Our results can be partially explained by the fact that we did not take into account the amount of protein intake and physical activity, which have been shown to be associated with lower albumin concentrations. Previous studies, especially in older patients, also did not identify a correlation between serum albumin and LBM.23,24
Our study had some limitations. First, the number of study patients was relatively small, adding to lack of statistical power. Second, LVMI was measured by echocardiography; however, magnetic resonance imaging could be used to obtain more objective results. Finally, the cross-sectional design is another limitation, since it cannot imply a cause-effect relationship.
Conclusions
Our study suggests that LBM has a significant influence on LVMI and RRI. Hence, body composition analysis could be an early predictor of graft function and cardiovascular outcomes in normotensive RTRs.
References:
- Dienemann T, Ziolkowski SL, Bender S, et al. Changes in body composition, muscle strength, and fat distribution following kidney transplantation. Am J Kidney Dis. 2021;78(6):816-825. doi:10.1053/j.ajkd.2020.11.032
CrossRef - PubMed - Heleniak Z, Illersperger S, Brakemeier S, Debska-Slizien A, Budde K, Halleck F. Obesity, fat tissue parameters, and arterial stiffness in renal transplant recipients. Transplant Proc. 2020;52(8):2341-2346. doi:10.1016/j.transproceed.2020.01.118
CrossRef - PubMed - Rangaswami J, Mathew RO, Parasuraman R, et al. Cardiovascular disease in the kidney transplant recipient: epidemiology, diagnosis and management strategies. Nephrol Dial Transplant. 2019;34(5):760-773. doi:10.1093/ndt/gfz053
CrossRef - PubMed - Yuksel Y, Tekin I, Erbis H, et al. A single-center experience with kidney transplantation in patients who had low left ventricular ejection fraction. Exp Clin Transplant. Accepted manuscript. Published online January 16, 2023;10.6002/ect.2022.0175. doi:10.6002/ect.2022.0175
CrossRef - PubMed - Levey AS, Stevens LA, Schmid CH, et al. A new equation to estimate glomerular filtration rate. Ann Intern Med. 2009;150(9):604-612. doi:10.7326/0003-4819-150-9-200905050-00006
CrossRef - PubMed - Ye R, Liu K, Gong S, Li J, Xu Y, Chen X. The association between morning blood pressure and subclinical target organ damage in the normotensive population. J Hypertens. 2019;37(7):1427-1436. doi:10.1097/HJH.0000000000002036
CrossRef - PubMed - Lang RM, Bierig M, Devereux RB, et al. Recommendations for chamber quantification: a report from the American Society of Echocardiography's Guidelines and Standards Committee and the Chamber Quantification Writing Group, developed in conjunction with the European Association of Echocardiography, a branch of the European Society of Cardiology. J Am Soc Echocardiogr. 2005;18(12):1440-1463. doi:10.1016/j.echo.2005.10.005
CrossRef - PubMed - Devereux RB, Reichek N. Echocardiographic determination of left ventricular mass in man. Anatomic validation of the method. Circulation. 1977;55(4):613-618. doi:10.1161/01.cir.55.4.613
CrossRef - PubMed - Pontremoli R, Viazzi F, Martinoli C, et al. Increased renal resistive index in patients with essential hypertension: a marker of target organ damage. Nephrol Dial Transplant. 1999;14(2):360-365. doi:10.1093/ndt/14.2.360
CrossRef - PubMed - Karacaglar E, Akgun AN, Muderrisoglu IH, Haberal M. Incidence of cardiovascular events after renal transplantation. Exp Clin Transplant. 2020;18(Suppl 1):70-72. doi:10.6002/ect.TOND-TDTD2019.P18
CrossRef - PubMed - Piskin T, Simsek A, Murat-Dogan S, et al. Mortality after kidney transplantation: 10-year outcomes. Cir Cir. 2022;90(2):172-179. doi:10.24875/CIRU.21000300
CrossRef - PubMed - Giamouzis G, Dimos A, Xanthopoulos A, Skoularigis J, Triposkiadis F. Left ventricular hypertrophy and sudden cardiac death. Heart Fail Rev. 2022;27(2):711-724. doi:10.1007/s10741-021-10134-5
CrossRef - PubMed - Tanaka M. Improving obesity and blood pressure. Hypertens Res. 2020;43(2):79-89. doi:10.1038/s41440-019-0348-x
CrossRef - PubMed - Abbasi SA, Hundley WG, Bluemke DA, et al. Visceral adiposity and left ventricular remodeling: the multi-ethnic study of atherosclerosis. Nutr Metab Cardiovasc Dis. 2015;25(7):667-676. doi:10.1016/j.numecd.2015.03.016
CrossRef - PubMed - Norton GR, Peterson VR, Robinson C, et al. Independent of left ventricular mass, circulating inflammatory markers rather than pressure load are associated with concentric left ventricular remodelling. Int J Cardiol. 2019;274:342-347. doi:10.1016/j.ijcard.2018.09.059
CrossRef - PubMed - Fox CS, Gona P, Hoffmann U, et al. Pericardial fat, intrathoracic fat, and measures of left ventricular structure and function: the Framingham Heart Study. Circulation. 2009;119(12):1586-1591. doi:10.1161/CIRCULATIONAHA.108.828970
CrossRef - PubMed - Shea JR, Henshaw MH, Carter J, Chowdhury SM. Lean body mass is the strongest anthropometric predictor of left ventricular mass in the obese paediatric population. Cardiol Young. 2020;30(4):476-481. doi:10.1017/S1047951120000311
CrossRef - PubMed - K CT, Das SK, Shetty MS. Renal resistive index: revisited. Cureus. 2023;15(3):e36091. doi:10.7759/cureus.36091
CrossRef - PubMed - Radermacher J, Mengel M, Ellis S, et al. The renal arterial resistance index and renal allograft survival. N Engl J Med. 2003;349(2):115-124. doi:10.1056/NEJMoa022602
CrossRef - PubMed - Cilsal E, Koc AS. Renal resistive index significantly increased in hypertensive children and it is independently related to the pulse pressure and left ventricular mass index. Clin Exp Hypertens. 2019;41(7):607-614. doi:10.1080/10641963.2018.1523920
CrossRef - PubMed - Eckart A, Struja T, Kutz A, et al. Relationship of nutritional status, inflammation, and serum albumin levels during acute illness: a prospective study. Am J Med. 2020;133(6):713-722 e717. doi:10.1016/j.amjmed.2019.10.031
CrossRef - PubMed - Visser M, Kritchevsky SB, Newman AB, et al. Lower serum albumin concentration and change in muscle mass: the Health, Aging and Body Composition Study. Am J Clin Nutr. 2005;82(3):531-537. doi:10.1093/ajcn.82.3.531
CrossRef - PubMed - Starling RD, Ades PA, Poehlman ET. Physical activity, protein intake, and appendicular skeletal muscle mass in older men. Am J Clin Nutr. 1999;70(1):91-96. doi:10.1093/ajcn/70.1.91
CrossRef - PubMed - Bouillanne O, Hay P, Liabaud B, Duche C, Cynober L, Aussel C. Evidence that albumin is not a suitable marker of body composition-related nutritional status in elderly patients. Nutrition. 2011;27(2):165-169. doi:10.1016/j.nut.2009.12.007
CrossRef - PubMed

Volume : 22
Issue : 2
Pages : 108 - 113
DOI : 10.6002/ect.2023.0192
From the Department of Nephrology, Yildirim Beyazit University Faculty of Medicine, Ankara, Turkey
Acknowledgements: The authors have not received any funding or grants in support of the presented research or for the preparation of this work and have no declarations of potential conflicts of interest. We thank the reviewers for their helpful comments on this article.
Corresponding author: Bahar Gurlek Demirci, Yildirim Beyazit University Faculty of Medicine, Department of Nephrology, Ankara 06800, Turkey
Phone: +90 5323774704
E-mail: bahargurlek@gmail.com
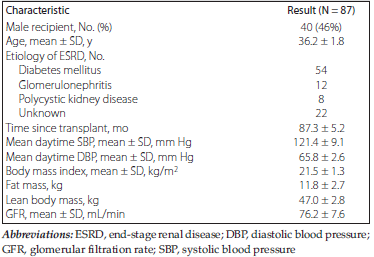
Table 1.Demographic and Clinical Characteristics of the Study Population
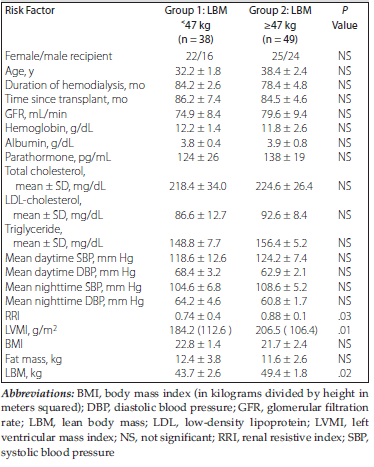
Table 2.Demographic, Clinical, Laboratory, and Bioimpedance Analysis of Study Groups
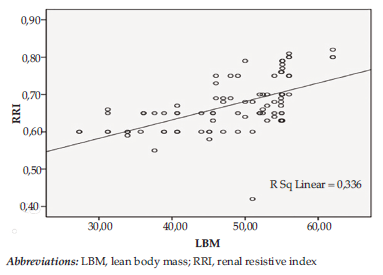
Figure 1.Pearson Correlation Analysis Between Lean Body Mass and Renal Resistive Index
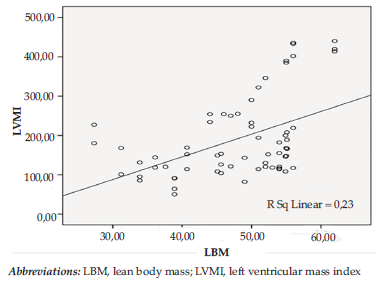
Figure 2.Pearson Correlation Analysis Between Lean Body Mass and Left Ventricular Mass Index

Figure 3.Subgroup Analysis of Patients by Means of Left Ventricular Mass Index

Figure 4.Subgroup Analysis of Patients by Means of Renal Resistive Index