Volume: 21 Issue: 7 July 2023
FULL TEXT
Objectives: Allograft biopsy is the gold standard for diagnosing polyomavirus-associated nephropathy. We aimed to establish the effects of histopathologic findings proposed by the Banff Polyomavirus Working Group on graft outcome. We also aimed to understand the clinical importance of follow-up biopsies for patients with polyomavirus-associated nephropathy.
Materials and Methods: Our study included 22 patients with polyomavirus-associated nephropathy. All biopsies were classified according to the latest Banff Polyomavirus Working Group classification. Follow-up biopsies of all patients were evaluated in detail.
Results: The mean interval between polyomavirus-associated nephropathy and transplant was 10 ± 1.6 months. Of 22 patients, biopsy revealed stage 1 in 3 (13.6%), stage 2 in 17 (77.3%), and stage 3 in 2 patients (9.1%). Fourteen patients (63.6%) had polyomavirus viral load 3, 5 (22.7%) had polyomavirus viral load 2, and 3 had polyomavirus viral load 1. Among patients included in analyses, 18.2% had antibody-mediated rejection and 27.2% had T-cell-mediated rejection simultaneously with polyomavirus-associated nephropathy. Graft loss increased with increasing polyomavirus-associated nephropathy class and polyomavirus viral load (P = .015 and P = .002, respectively). The mean time of graft survival decreased with increasing degree of tubulitis, interstitial inflammation, plasma infiltration, and neutrophil infiltration. Patients with interstitial fibrosis, glomerular polyoma, and cortical plus medullar involvement showed earlier graft loss. Follow-up biopsies showed that diffuse interstitial fibrosis or persistent inflam-mation negatively influenced graft loss.
Conclusions: The Banff Polyomavirus Working Group’s schema significantly correlated with graft outcome. Early detection of polyomavirus-associated nephro-pathy and subsequent detection of persistent inflammation and interstitial fibrosis and tubular atrophy in follow-up biopsies and modification of immunosuppressive therapy can successfully prevent graft loss.
Key words : BK virus, Graft survival, Histopathology, Kidney transplant, Polyomavirus nephropathy
Introduction
BK virus (BKV) primary infection occurs in early childhood and remains latent for a lifetime.1,2 In the context of immunosuppression and other predisposing factors such as cancer, diabetes, and transplantation, BKV may reactivate.2,3 The reactivation of BKV may cause severe illnesses known as polyomavirus nephropathy (PVAN).4,5 Polyomavirus nephropathy is increasingly recog-nized as the critical and leading cause of renal allograft failure and occurs in up to 10% of kidney allograft recipients.5-8 Overall, the reported incidence of allograft failure ranges from 15% to 50% of affected individuals.5-8 Polyomavirus nephropathy can result from multiple risk factors, including determinants of the patient, allograft, and BKV infection.4,6-10 The replication of BKV typically begins early after transplant and after treatment of rejection. Therapy for acute rejection causes prominent immunosup-pression with insufficient immunological control, which increases the risk of PVAN.4,10
Polyomavirus DNA quantitation analyses of the blood and urine are the applicable diagnostic methods.2,4,6 Nevertheless, histopathologic demonstra-tion of viral inclusions in the kidney is the gold standard for diagnosis. Currently, most studies have only documented the presence of PVAN without further histopathologic prognostic parameters. Authors have previously proposed the inclusion of some histopathologic findings in the pathology report. They concluded that describing the involve-ment pattern and the quantity of viral cytopathic changes in the kidney might help subclassify patients to improve diagnostic communication and give more accurate graft outcomes.4,6,11 These previous classification attempts have not gained broad acceptance.11-13 Thus, Banff created a multicenter working group to develop a clinically relevant morphologic classification for PVAN.14-16 This proposed classification reflects a reproducible and universal grading schema for PVAN.16 A recent multicenter study validated the significance of the 2018 Banff Working Group PVAN classification.17 The recognition of PVAN classes and polyomavirus viral load (pvl) is intended to become a tool that will provide uniform histopathologic correlates to graft outcomes and aid clinicians in managing and monitoring responses to therapy in patients with PVAN.
In this study, we aimed to establish the effects of histopathologic findings proposed by the Banff Polyomavirus Working Group on graft outcome. Second, we aimed to understand the clinical impor-tance of subsequent follow-up biopsies in patients with PVAN.
Materials and Methods
Our study included 22 patients (18 male/4 female patients) with a mean age of 38.1 ± 17 years (range, 2-66 years). Patient characteristics are listed in Table 1 and Table 2. Maintenance therapy consisted of triple treatment with corticosteroids, a calcineurin inhibitor (tacrolimus or cyclosporin A), and mycop-henolate mofetil. To observe changes in creatinine levels during follow-up, patients received asses-sment of baseline creatinine, creatinine at the time of index biopsy, and follow-up creatinine at month 3 and month 6 (Table 2). The number of viral copies in serum above 4 log10 BK copies/mL was accepted as positive for PVAN. Simian virus large T-antigen staining (SV40; Sigma-Aldrich) was performed for the confirmation of PVAN (Figure 1). All cores of renal biopsies were routinely immunostained with C4d (Medaysis), CD68, CD3, and HLA-DR antibodies (Agilent Dako) in an autostainer (OMNIS, Agilent Dako).
Sixty-three allograft biopsies from 22 patients were reevaluated. Of 63 biopsies, 22 were diagnostic index biopsies, with the remaining being follow-up biopsies. Polyomavirus nephropathy was reclassified according to the grading schema proposed by the Banff Polyomavirus Working Group.16 All index biopsies were scored for the degree of interstitial inflammation (i), tubulitis (t), and ci scores.18 In addition, interstitial plasma and neutrophil leukocyte infiltrations were scored: group 1 had plasma or neutrophil levels of >10% of the infiltrate, and group 2 had plasma or neutrophil levels of >10% of the infiltrate. Traces of polyomavirus, persistent inflam-mation (Pinf), and diffuse interstitial fibrosis (IF) (ci score = 3) were evaluated in subsequent follow-up biopsies.
All types of BKV intranuclear inclusions in biopsies were noted19: type 1 was noted as having amorphous basophilic inclusions with a “ground-glass” appearance, type 2 was noted as having a central irregular inclusion body surrounded by a halo (cytomegalovirus [CMV]-like inclusions), type 3 was noted as having finely granular nuclear chromatin alterations, and type 4 was noted as having vesicular nuclei with coarsely clumped chromatin and evident nucleoli (Figure 2).
The Banff scores and the time of the acute T-cell-mediated rejection (TCMR) and acute/active antibody-mediated rejection (ABMR) episodes were determined. Patients with PVAN and simultaneous TCMR were treated with pulse intravenous methylprednisolone, whereas recipients with simultaneous ABMR were treated with only plasmapheresis. A reduction of maintenance immunosuppression was made for all patients.
This work is consistent with the Principles of the Declaration of Istanbul outlined in the “Declaration of Istanbul on Organ Trafficking and Transplant Tourism.” Individual-level informed consent was not obtained as the data were collected retrospectively.
Statistical analyses
We used IBM SPSS software (Statistical Package for the Social Sciences, version 25.0) for statistical analysis. All values are presented as the mean ± SE. Mean values of quantitative data were compared using analysis of variance. We evaluated statistical differences in categorical variables using the Pearson chi-square test or the Fisher exact test, as appropriate. We used the Spearman correlation test to analyze correlations among quantitative data. Results were considered statistically significant at P < .05.
Results
Between 2006 and 2011, 462 kidney transplants (300 male patients, 65%) were performed at our hospital. Among these, 22 patients with biopsy-confirmed PVAN were identified. The overall incidence of the development of PVAN among our transplant population was 4.7%. There was a male predominance (18/22, 81.8%) (Table 1). The incidence of PVAN was significantly higher in male (18/300; 6%) than in female (4/162; 2.4%) patients. The risk of development of PVAN in male patients was 2.5-fold higher than in female patients. The mean age at the time of PVAN was 37.3 ± 17 years (range, 12-65 years), and only 4 of 22 patients (18.2%) were younger than 19 years and 8 patients (36.4%) older than 50 years (Table 1). We observed that PVAN development was significantly higher in patients older than 50 years (8/65; 12.3%) than in patients younger than 50 years (14/447; 3%). The risk of development of PVAN in patients older than 50 years was 4.1-fold higher than in younger patients. The graft source was deceased donors in 7 patients (31.8%) and living-related donors in 8 patients (36.4%). The remaining 7 patients (31.8%) received kidneys from their spouses. Tacrolimus (n = 16; 72.7%) was the most common immunosup-pressive agent. The remaining 4 and 2 patients were taking cyclosporine A and sirolimus therapy, respectively.
The mean interval between PVAN and transplant was 10 ± 1.6 months (range, 3-27 mo). Of 22 patients, 9 (40.9%) had proteinuria, 3 (13.6%; patients 10, 11, and 13) had CMV coinfection, and 4 (18.2%; patients 11, 15, 18, and 19) had diabetes mellitus at the time of PVAN diagnosis. Four patients (18.2%) had acute/active ABMR, and 6 patients (27.2%) had acute TCMR (all cases were type 2) at the same time as PVAN. Among these cases, only 1 patient had mixed TCMR and ABMR. In addition, 3 patients had acute TCMR (patients 6 and 15 had type 1 and patient 13 had type 2 rejection) before PVAN at a mean time of 4.3 months, and 2 patients had acute/active ABMR before PVAN at a mean time of 5 months (Table 1). All patients with ABMR had positive C4d along peritubular capillaries, and all patients with TCMR had tubular HLA-DR expression.
Cortical biopsy cores were present in all patients, and the medulla was represented in only 18 patients (81.8%) (Table 1). Six patients (27.2%) showed only cortical involvement, and 2 patients (9.1%) showed only medullar involvement. Both cortical and medullar involvement was found in 14 patients (63.6%). Significant differences were shown in involvement type with regard to index biopsy creatinine and change in creatinine from baseline to the time of index biopsy (Table 3). Recipients with only medullar involvement showed lower index biopsy creatinine levels (P = .012) and lower change of creatinine levels (P = .02) than patients with other involvement types.
Only 4 patients showed distinct alterations in the parietal epithelial cells of glomeruli that were positive with SV40 (Figure 1). Patients with glomerular polyoma showed higher index biopsy creatinine levels and change in creatinine levels than patients without glomerular involvement (Table 3). Levels of creatinine at the month 3 and month 6 follow-up were also higher in recipients with glomerular polyomavirus. Although not statistically significant, there was an association between glomerular polyoma and the degree of pvl score in 3 of 4 patients with glomerular involvement showing a pvl3 score (Table 4).
The distribution of intranuclear viral inclusion types is listed in Table 1. Type 2 (P = .026, r = 0.472) and type 4 (P = .002, r = 0.631) viral inclusions were positively associated with the degree of pvl. In contrast, type 3 (P = .037, r = -0.448) inclusions negatively correlated with the degree of pvl. Type 2 (P = .02, r = 0.493) and type 4 (P = .001, r = 0.659) viral inclusions also positively correlated with the involvement type of the PVAN. The Pinf (P = .002, r = 0.624) and the IF (ci score = 3) (P < .001, r = 0.748) in the follow-up biopsies and graft loss (P < .001, r = 0.683) were positively influenced by type 2 and type 4 viral inclusions (P < .001, r = 0.833; P < .001, r = 0.817; and P < .001, r = 0.913, respectively).
Table 1 and Table 2 show the incidence of PVAN classes and pvl scores. Patients with class 1 PVAN were diagnosed at a mean time of 7.6 ± 0.33 months after transplant and showed a modest rise in serum creatinine levels (mean change from baseline to time of index biopsy of 0.37 ± 0.03 mg/dL) (Table 3). In addition, recipients with class 2 and class 3 PVAN were diagnosed 10.7 ± 2 and 7.5 ± 1.5 months posttransplant, respectively. The mean change of creatinine from baseline to time of index biopsy was 1.18 ± 0.13 and 2.24 ± 0.34 mg/dL for patients with class 2 and class 3 PVAN, respectively (P = .004) (Table 2 and Table 3). The mean change in creatinine also increased with increasing pvl (P = .016).
All 3 patients with class 1 and pvl1 were diagnosed 6 months posttransplant. However, all patients diagnosed with PVAN within 6 months posttransplant showed higher classes and pvl score (Table 4). Neither patients in class 1 nor pvl1 showed cortical plus medullar involvement, significant tubulitis (>t1), interstitial inflammation (>i1), plasma infiltration (P2), or neutrophil infiltration (N2) in index biopsy and Pinf in follow-up biopsy. On the other hand, patients with higher classes and higher pvl grades showed higher rates of tubulitis, inflam-mation, plasma and neutrophil infiltration, cortical plus medullar involvement, and Pinf (Table 4).
The mean change in creatinine between baseline creatinine and creatinine at index biopsy was 1.16 ± 0.14 mg/dL. Patients with glomerular polyoma, cortical plus medullar involvement, proteinuria, Pinf, significant plasma (P2) and neutrophil (N2) infiltration, and ci score ≥1 had higher levels of creatinine levels at the time of index biopsy and during follow-up (Table 3). These patients also showed the most significant changes in creatinine values between baseline and index biopsies. The change in creatinine level between baseline and index biopsy showed a positive correlation with month 3 creatinine level (r = 0.83, P < .001) and month 6 creatinine level (r = 0.85, P < .001) and a negative correlation with the median time of the development of IF (r = -0.81, P = .005) and graft survival (r = -0.92, P < .001).
Among 22 patients, 13 patients (59.1%) showed IF (ci score ≥1) in index biopsies (Table 3). Patients who had ci score ≥1 in index biopsy showed higher creatinine levels at the time of PVAN and higher levels of creatinine changes than patients who did not have IF in index biopsy. A ci score ≥1 in the index biopsy was significantly associated with the PVAN classes (P = .02) and pvl scores (P = .008). Neither patients with class 1 nor pvl1 had IF (ci score ≥1) in index biopsies. During follow-up, 10 patients developed diffuse IF (ci score = 3) at a mean time of 4 ± 1 months. None of the patients with class 1 PVAN developed diffuse IF, whereas 47% of patients (n = 8) with class 2 PVAN and all cases (n = 2) with class 3 developed diffuse IF (ci score = 3) at a mean time of 4 ± 1 months. The development of diffuse IF was 0%, 20%, and 64,3% for patients with pvl1, pvl2, and pvl3, respectively (P = .02).
As shown in Table 4, patients with proteinuria, Pinf, cortical plus medullar involvement, and significant plasma (P2) and neutrophil (N2) infiltration in the index biopsy showed a higher incidence of IF (ci score = 3) development in follow-up biopsies. The risk of diffuse IF in follow-up biopsies increased with increasing degree of interstitial inflammation and tubulitis in index biopsy. The diffuse IF development risk in follow-up biopsies was also higher in recipients diagnosed with PVAN within 6 months after transplant.
Eleven patients (50%) lost their graft at 15.6 ± 3.2 months after PVAN (Table 3). The mean time for graft loss was 78 ± 2.3, 38.9 ± 6.3, and 11 ± 4 months for recipients with class 1, class 2, and class 3 PVAN, respectively (P = .015). Overall 5-year graft survival after PVAN was 100%, 47%, and 0% for patients with class 1, class 2, and class 3, respectively (P = .046). Patients with pvl3 PVAN (27.5 ± 6 mo) showed the earliest graft loss compared with recipients with pvl1 (78 ± 2.3 mo) and pvl2 (59.8 ± 10 mo) (P = .002). Overall 5-year graft survival after PVAN was 100%, 80%, and 28% for patients with pvl1, pvl2, and pvl3, respectively (P = .039).
The mean graft survival after PVAN in recipients whose BK polyomavirus infection was detected within 6 months was 21.3 ± 7.3 months, whereas it was 55.8 ± 6.6 months for patients diagnosed after 6 months (P = .003). The mean time of graft survival decreased with increasing degree of interstitial inflammation, plasma and neutrophil infiltration, and tubulitis in index biopsy. Patients with glomerular polyoma, proteinuria, ci score ≥1, and cortical plus medullar involvement showed earlier graft loss (Table 3). The overall 5-year graft survival after PVAN was 89% and 23% for patients with a ci score <1 and with a ci score ≥1, respectively (P = .002). Patients with simultaneous CMV infection and PVAN had poor graft survival (15.3 ± 2.6 mo) compared with recipients without concurrent CMV (52.4 ± 5.6 mo) (P = .02). Four of 6 patients with TCMR lost their renal allograft at a mean time of 18.2 ± 6.8 months after PVAN. Additionally, 2 of 4 patients with ABMR lost their allografts at a mean time of 21 ± 15 months after PVAN. The remaining recipients had stable renal function over 62.5 ± 7.1 months.
Pinf and diffuse IF (ci score = 3) in the follow-up biopsies negatively influenced graft survival after PVAN (Table 3). Overall 5-year graft survival after PVAN was 100% and 8% for patients without and with Pinf in follow-up biopsies, respectively (P < .001). Overall 5-year graft survival after PVAN was 91% and 0% for patients without and with IF in follow-up biopsies, respectively (P < .001).
Discussion
Polyomavirus-associated nephropathy is the most critical infectious complication leading to graft loss. Although the incidence of biopsy-proven PVAN varies significantly between centers, the incidence has been reported to generally range between 5% and 6%.5-8,20,21 Likewise, our institute’s transplant population’s biopsy-proven PVAN nephropathy rate was 4.7%. BK virus replication mainly develops within the first 6 months posttransplant, and polyomavirus replication can be detected as early as 1 month posttransplant.13,20-22 Graft survival has been reported to be poor in recipients whose PVAN was detected within 6 months after transplant. The 36-month graft survival rate of patients with PVAN detected within 6 months after renal transplant was shown to be 79%, with a rate of 90% in controls (renal transplant recipients without BKV nephropathy within 6 mo).22 In support of these findings, we also showed that the mean graft survival after PVAN in recipients whose infection was detected within 6 months was 21.3 ± 7.3 months, whereas it was 55.8 ± 6.6 months for patients who were diagnosed after 6 months.
BK virus replication is associated with various risk factors, such as tacrolimus use, male sex, older age, diabetes mellitus, ischemia-reperfusion injury, HLA mismatches, acute rejection episodes, ureteral stent placement, and specific HLA-C alleles.4,8,9,22,23 Similarly, the risk of PVAN in our male patients was 2.5-fold higher than in female patients. In addition, the risk of PVAN in patients older than 50 years of age was 4.1-fold higher than in younger patients. Among our patients, 18.2% had type 2 diabetes mellitus. In addition, 3 and 2 patients had TCMR and ABMR before the PVAN diagnosis, respectively. The type of immunosuppression, especially tacrolimus, is critical in the induction of BKV replication.8,12,13,20,22-26 Our results confirm this suggestion, in that most of our recipients (72.7%) were taking tacrolimus.
Earlier PVAN classification schemas generated by the Banff Working Group were based only on histo-logic changes and did not have broad acceptance or clinical relevance.6,11,13 Recently, the Banff Working Group on PVAN proposed a novel classification of definitive PVAN, including the “ci score” with the “pvl score” being the only addition.16 The Group also designed a multicenter cohort study to validate the clinical significance of this classification.17 They concluded that this newest Banff schema provides essential clinical information and facilitates the outcome analyses of PVAN. Other studies also confirm the validity of the classification.25,27 Similarly, our study demonstrated the prognostic significance of this PVAN classification. The overall 5-year graft survival after PVAN was 100%, 47%, and 0% for patients with class 1, 2, and 3, respectively. The predictive values of the ci score and the pvl score was also shown in our work; the overall 5-year graft survival was 23% and 28% for the PVAN patients with a ci score ≥1 and pvl score of 3, respectively. In contrast, other studies found no association between the recent Banff PVAN classification and graft survival.25,26
Kowalewska and colleagues25 reported that the latest Banff PVAN classification could not identify and stratify recipients with regard to renal allograft outcome. The investigators stated that, although class 3 was strongly related to poor renal allograft prognosis, no significant difference could be demonstrated between the outcomes for classes 1 and 2.25 In contrast, our study showed a substantial difference between class 1 and class 2 with regard to graft survival.
Bouatou and colleagues26 stated that the 2018 Banff PVAN schema or previously published PVAN classification systems could not be applied to their multicenter recipient cohort. They suggested that there might be a predictive value for follow-up biopsies to improve risk stratification after PVAN.26 In support of Bouatou and colleagues, we demonstrated the prognostic significance of follow-up biopsies among our cases. As shown in our patients, Pinf and diffuse IF (ci score = 3) in follow-up biopsies were the most important predictive factor for graft survival. Overall 5-year graft survival was 8% and 0% for our patients with Pinf and IF in follow-up biopsies, respectively.
Various histopathologic features in index biopsy also have important predictive values for graft survival, similar to follow-up biopsies. In index biopsies, the degree of tubulitis, interstitial inflam-mation, and plasma and neutrophil infiltration are significantly correlated with graft survival. Furthermore, the distribution of viral inclusions throughout the renal biopsy and the type of viral inclusions, especially type 2 and type 4, are significantly correlated with poor graft survival. Inclusions in the glomerular parietal epithelial cells and detection of tubular viral inclusions in both the cortex and medulla adversely affect graft survival. The BKV infection begins to replicate in the collecting and distal convoluted tubules in the medulla and progressively spreads to the tubules in the renal cortex. The distribution of BKV in the kidney is frequently in a patchy pattern. The BKV intranuclear inclusions are primarily monitored throughout the corticomedullary junction. Thus, exemplifying both cortical and medullary areas in renal parenchyma is essential for accurate diagnosis and prognosis.28
In our study, medullar involvement was associated with PVAN diagnosis in 72.7% of recipients. Recipients with only medullary involvement showed lower creatinine levels at the time of index biopsy and change of creatinine levels versus patients with other involvement types. Patients with both cortical and medullar involvement showed the lowest graft survival, with graft survival of 78 months for patients with medullar involvement and 28.9 months for patients with both cortical and medullar involvement. In advanced stages of PVAN, viral replication may be found in the glomeruli, resulting in irreversible injury. The presence of viral inclusions in the parietal cells of glomeruli is associated with a poor prognosis.29,30 In a study from Çelik and colleagues, BKV cytopathic changes were observed in the glomeruli in 17% of kidney allograft biopsies.30
We found 18.2% of our biopsies showing SV40-positive inclusions in the parietal cells of glomeruli. The presence of glomerular polyoma demonstrates more severe pathologic damage and an abrupt decrease in renal function, associated with poor prognosis.29,30 We confirmed the adverse effect of glomerular polyomavirus on graft survival. Compared with recipients without glomerular viral replication, patients with glomerular polyoma had higher creatinine levels at the time of index biopsy and during follow-up. Graft survival was 15.7 ± 3.9 months for patients with glomerular polyoma and 51.7 ± 5.2 months for patients without glomerular involvement. We demonstrated that the glomerular polyoma is significantly higher in biopsies with high pvl degrees, as confirmed previously.30
The inflammation in PVAN is in a patchy pattern and mainly comprises a mixed population of leukocytes and many plasma cells. The histologic features of PVAN are also almost identical to the histology of TCMR. Hence, making a differential diagnosis when accompanied by TCMR becomes challenging. In such cases, as shown in our study, demonstrating tubular HLA-DR expression and distinctive tubulitis in regions far from the viral cytopathic alterations will help favor TCMR in the diagnosis.31-33
Both BKV and CMV are primary viruses influencing graft survival. The coexistence of BKV and CMV can have a more potent effect on renal allograft outcome than a single infection.34-36 In vitro studies demonstrated that CMV could induce amplification of BKV.36 Coinfection with BKV and CMV is significantly associated with inferior allograft function. Our results also confirmed poor outcomes in patients with simultaneous BKV and CMV infection.
Interstitial fibrosis and tubular atrophy are among the most critical factors in predicting the prognosis of renal allografts with PVAN and depend on the balance between tubular repair mechanisms and epithelial-to-mesenchymal transition.37-39 In our study, patients with a ci score <1 in index biopsy had more elevated serum creatinine and graft loss than patient with a ci score <1. Scoring for ci implies that patients without IF in the index biopsy will have a favorable graft survival versus patients with higher ci scores. We also demonstrated that patients with Pinf and diffuse IF (ci score = 3) in follow-up biopsies had poor renal outcomes. Our results showed the importance of follow-up biopsies and that Pinf was significantly associated with IF progression and an increased risk of graft loss.
Our study supports the clinical relevance of the latest PVAN Banff classification by showing that classes of PVAN significantly predicted graft outcomes. Class 1 indicated a favorable prognosis, whereas class 3 indicated the poorest prognosis. The most striking predictive feature in class 2 was the presence of Pinf and diffuse IF (ci score = 3) in follow-up biopsies. Detailed histopathologic information obtained from follow-up biopsies can identify the issues that must be resolved to protect the renal allograft. We suggest that early detection of PVAN and subsequent detection of Pinf and IF in follow-up biopsies and modification of immunosuppressive therapy can successfully prevent graft loss in patients with PVAN.
References:
- Vanchiere JA, Nicome RK, Greer JM, Demmler GJ, Butel JS. Frequent detection of polyomaviruses in stool samples from hospitalized children. J Infect Dis. 2005;192(4):658-664. doi:10.1086/432076
CrossRef - PubMed - Shah KV. Simian virus 40 and human disease. J Infect Dis. 2004;190(12):2061-2064. doi:10.1086/425999
CrossRef - PubMed - Eash S, Manley K, Gasparovic M, Querbes W, Atwood WJ. The human polyomaviruses. Cell Mol Life Sci. 2006;63(7-8):865-876. doi:10.1007/s00018-005-5454-z
CrossRef - PubMed - Hirsch HH, Brennan DC, Drachenberg CB, et al. Polyomavirus-associated nephropathy in renal transplantation: interdisciplinary analyses and recommendations. Transplantation. 2005;79(10):1277-1286. doi:10.1097/01.tp.0000156165.83160.09
CrossRef - PubMed - Wadei HM, Rule AD, Lewin M, et al. Kidney transplant function and histological clearance of virus following diagnosis of polyomavirus-associated nephropathy (PVAN). Am J Transplant. 2006;6(5 Pt 1):1025-1032. doi:10.1111/j.1600-6143.2006.01296.x
CrossRef - PubMed - Drachenberg CB, Beskow CO, Cangro CB, et al. Human polyoma virus in renal allograft biopsies: morphological findings and correlation with urine cytology. Hum Pathol. 1999;30(8):970-977. doi:10.1016/s0046-8177(99)90252-6
CrossRef - PubMed - Ramos E, Drachenberg CB, Papadimitriou JC, et al. Clinical course of polyoma virus nephropathy in 67 renal transplant patients. J Am Soc Nephrol. 2002;13(8):2145-2151. doi:10.1097/01.asn.0000023435.07320.81
CrossRef - PubMed - Bohl DL, Storch GA, Ryschkewitsch C, et al. Donor origin of BK virus in renal transplantation and role of HLA C7 in susceptibility to sustained BK viremia. Am J Transplant. 2005;5(9):2213-2221. doi:10.1111/j.1600-6143.2005.01000.x
CrossRef - PubMed - Vera-Sempere FJ, Rubio L, Felipe-Ponce V, et al. Renal donor implication in the origin of BK infection: analysis of genomic viral subtypes. Transplant Proc. 2006;38(8):2378-2381. doi:10.1016/j.transproceed.2006.08.049
CrossRef - PubMed - Ramos E, Drachenberg CB, Wali R, Hirsch HH. The decade of polyomavirus BK-associated nephropathy: state of affairs. Transplantation. 2009;87(5):621-630. doi:10.1097/TP.0b013e318197c17d
CrossRef - PubMed - Drachenberg CB, Papadimitriou JC, Hirsch HH, et al. Histological patterns of polyomavirus nephropathy: correlation with graft outcome and viral load. Am J Transplant. 2004;4(12):2082-2092. doi:10.1046/j.1600-6143.2004.00603.x
CrossRef - PubMed - Hirsch HH, Randhawa P; AST Infectious Diseases Community of Practice. BK virus in solid organ transplant recipients. Am J Transplant. 2009;9 Suppl 4:S136-146. doi:10.1111/j.1600-6143.2009.02904.x
CrossRef - PubMed - Masutani K, Shapiro R, Basu A, Tan H, Wijkstrom M, Randhawa P. The Banff 2009 Working Proposal for polyomavirus nephropathy: a critical evaluation of its utility as a determinant of clinical outcome. Am J Transplant. 2012;12(4):907-918. doi:10.1111/j.1600-6143.2012.03993.x
CrossRef - PubMed - Mengel M, Sis B, Haas M, et al. Banff 2011 Meeting report: new concepts in antibody-mediated rejection. Am J Transplant. 2012;12(3):563-570. doi:10.1111/j.1600-6143.2011.03926.x
CrossRef - PubMed - Haas M, Sis B, Racusen LC, et al. Banff 2013 meeting report: inclusion of c4d-negative antibody-mediated rejection and antibody-associated arterial lesions. Am J Transplant. 2014;14(2):272-283. doi:10.1111/ajt.12590
CrossRef - PubMed - Nickeleit V, Singh HK, Randhawa P, et al. The Banff Working Group classification of definitive polyomavirus nephropathy: morphologic definitions and clinical correlations. J Am Soc Nephrol. 2018;29(2):680-693. doi:10.1681/ASN.2017050477
CrossRef - PubMed - Nickeleit V, Singh HK, Dadhania D, et al. The 2018 Banff Working Group classification of definitive polyomavirus nephropathy: a multicenter validation study in the modern era. Am J Transplant. 2021;21(2):669-680. doi:10.1111/ajt.16189
CrossRef - PubMed - Roufosse C, Simmonds N, Clahsen-van Groningen M, et al. A 2018 reference guide to the Banff classification of renal allograft pathology. Transplantation. 2018;102(11):1795-1814. doi:10.1097/TP.0000000000002366
CrossRef - PubMed - Singh HK BL, Mihatsch MJ, Drachenberg C, Nickeleit V. Urine cytology findings of polyomavirus infections. In: Ahsan N, ed. Polyomaviruses and Human Diseases. Advances in Experimental Medicine and Biology. Springer; 2006:201-212.
CrossRef - PubMed - Manzano Sanchez D, Jimeno Garcia L, Manzano Sanchez D, et al. Renal function impairment in kidney transplantation: importance of early BK virus detection. Transplant Proc. 2019;51(2):350-352. doi:10.1016/j.transproceed.2018.12.016
CrossRef - PubMed - Sharif A, Alachkar N, Bagnasco S, et al. Incidence and outcomes of BK virus allograft nephropathy among ABO- and HLA-incompatible kidney transplant recipients. Clin J Am Soc Nephrol. 2012;7(8):1320-1327. doi:10.2215/CJN.00770112
CrossRef - PubMed - Schold JD, Rehman S, Kayle LK, Magliocca J, Srinivas TR, Meier-Kriesche HU. Treatment for BK virus: incidence, risk factors and outcomes for kidney transplant recipients in the United States. Transpl Int. 2009;22(6):626-634. doi:10.1111/j.1432-2277.2009.00842.x
CrossRef - PubMed - Demey B, Tinez C, Francois C, et al. Risk factors for BK virus viremia and nephropathy after kidney transplantation: a systematic review. J Clin Virol. 2018;109:6-12. doi:10.1016/j.jcv.2018.10.002
CrossRef - PubMed - Veduruvada R, Madireddy N, Koyya SS, et al. Clinicopathologic features of polyomavirus nephropathy: our experience. A retrospective observational study. Indian J Transplant. 2022;16(1):61-66. doi:10.4103/ijot.ijot_115_20
CrossRef - PubMed - Kowalewska J, El Moudden I, Perkowska-Ptasinska A, et al. Assessment of the Banff Working Group classification of definitive BK polyomavirus nephropathy. Transpl Int. 2021;34(11):2286-2296. doi:10.1111/tri.14003
CrossRef - PubMed - Bouatou Y, Nguyen TQ, Roelofs J, et al. A multicenter application of the 2018 Banff classification for BK polyomavirus-associated nephropathy in renal transplantation. Transplantation. 2019;103(12):2692-2700. doi:10.1097/TP.0000000000002712
CrossRef - PubMed - Subramanian KS, Srinivas BH, Nachiappa Ganesh R, et al. Revisit of polyomavirus nephropathy grading in renal allograft recipients according to the Banff 2019 Working Group Classification: a study from a large transplant center in South India. Cureus. 2022;14(2):e22377. doi:10.7759/cureus.22377
CrossRef - PubMed - Nankivell BJ, Renthawa J, Shingde M, Khan A. The importance of kidney medullary tissue for the accurate diagnosis of BK virus allograft nephropathy. Clin J Am Soc Nephrol. 2020;15(7):1015-1023. doi:10.2215/CJN.13611119
CrossRef - PubMed - Chen XT, Yang SC, Chen WF, et al. Glomerular parietal epithelial cells infection is associated with poor graft outcome in kidney transplant recipients with BK polyomavirus-associated nephropathy. J Infect Dis. 2019;219(12):1879-1886. doi:10.1093/infdis/jiz022
CrossRef - PubMed - Celik B, Randhawa PS. Glomerular changes in BK virus nephropathy. Hum Pathol. 2004;35(3):367-370. doi:10.1016/j.humpath.2003.09.009
CrossRef - PubMed - Ozdemir BH, Aksoy PK, Haberal AN, Demirhan B, Haberal M. Relationship of HLA-DR expression to rejection and mononuclear cell infiltration in renal allograft biopsies. Ren Fail. 2004;26(3):247-251. doi:10.1081/jdi-200026752
CrossRef - PubMed - Ozdemir BH, Bilezikci B, Haberal AN, Demirhan B, Gungen Y. Histologic evaluation, HLA-DR expression, and macrophage density of renal biopsies in OKT3-treated acute rejection: comparison with steroid response in acute rejection. Transplant Proc. 2000;32(3):528-531. doi:10.1016/s0041-1345(00)00875-7
CrossRef - PubMed - Nickeleit V, Hirsch HH, Zeiler M, et al. BK-virus nephropathy in renal transplants-tubular necrosis, MHC-class II expression and rejection in a puzzling game. Nephrol Dial Transplant. 2000;15(3):324-332. doi:10.1093/ndt/15.3.324
CrossRef - PubMed - Jehn U, Schutte-Nutgen K, Bautz J, et al. Clinical features of BK-polyomavirus and cytomegalovirus co-infection after kidney transplantation. Sci Rep. 2020;10(1):22406. doi:10.1038/s41598-020-79799-6
CrossRef - PubMed - Toyoda M, Puliyanda DP, Amet N, et al. Co-infection of polyomavirus-BK and cytomegalovirus in renal transplant recipients. Transplantation. 2005;80(2):198-205. doi:10.1097/01.tp.0000165110.78397.93
CrossRef - PubMed - Pari GS, St Jeor SC. Effect of human cytomegalovirus on replication of SV40 origin and the expression of T antigen. Virology. 1990;177(2):824-828. doi:10.1016/0042-6822(90)90558-9
CrossRef - PubMed - Meng XM, Nikolic-Paterson DJ, Lan HY. TGF-beta: the master regulator of fibrosis. Nat Rev Nephrol. 2016;12(6):325-338. doi:10.1038/nrneph.2016.48
CrossRef - PubMed - Ozdemir BH, Ozdemir FN, Demirhan B, Haberal M. TGF-beta1 expression in renal allograft rejection and cyclosporine A toxicity. Transplantation. 2005;80(12):1681-1685. doi:10.1097/01.tp.0000185303.92981.d6
CrossRef - PubMed - Ozdemir BH, Ozdemir FN, Gungen Y, Haberal M. Role of macrophages and lymphocytes in the induction of neovascularization in renal allograft rejection. Am J Kidney Dis. 2002;39(2):347-353. doi:10.1053/ajkd.2002.30555
CrossRef - PubMed

Volume : 21
Issue : 7
Pages : 568 - 577
DOI : 10.6002/ect.2023.0080
From the 1Department of Pathology, Baskent University, School of Medicine, Ankara; the 2Division of Health Sciences, Baskent University, Ankara; and the 3Department of Transplant Surgery, Baskent University, School of Medicine, Ankara, Turkiye
Acknowledgements: The authors have not received any funding or grants in support of the presented research or for the preparation of this work and have no declarations of potential conflicts of interest.
Corresponding author: B. Handan Ozdemir, Baskent University, Pathology Department, Ankara, Turkey
Phone: +90 5322243858
E-mail: handan27@hotmail.com
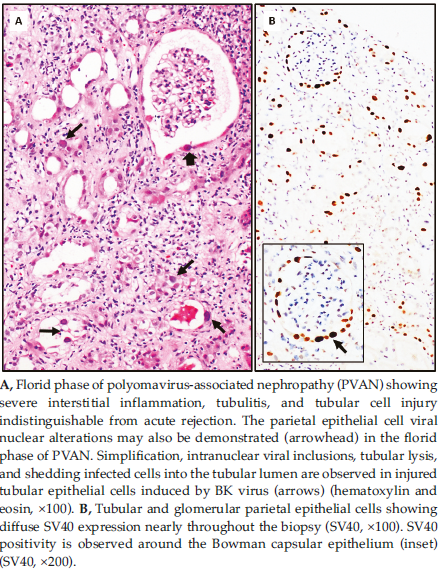
Figure 1. Diagnosis of Polyomavirus-Associated Nephropathy
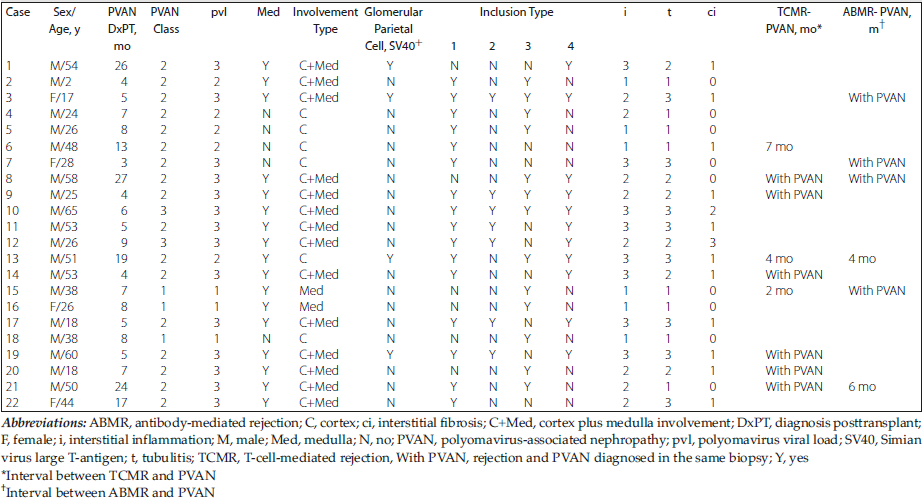
Table 1. Clinicopathologic Characteristics of Patients at the Time of Index Biopsy
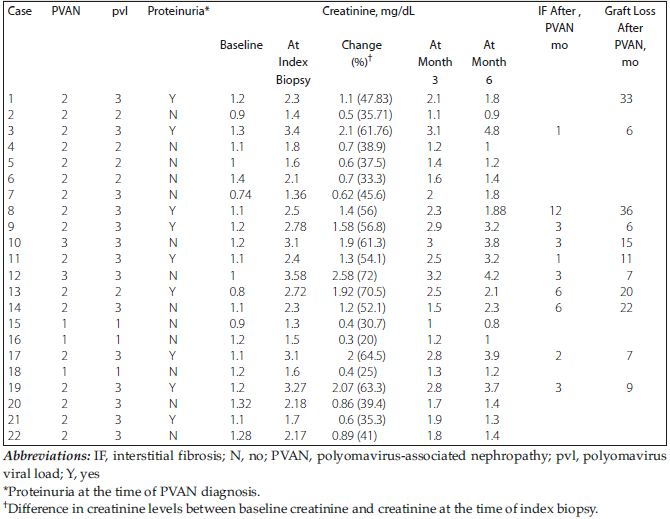
Table 2. Development of Diffuse Interstitial Fibrosis and Graft Loss During Follow-Up With Detailed Proteinuria and Creatinine Status of Patients at Time of Index Biopsy
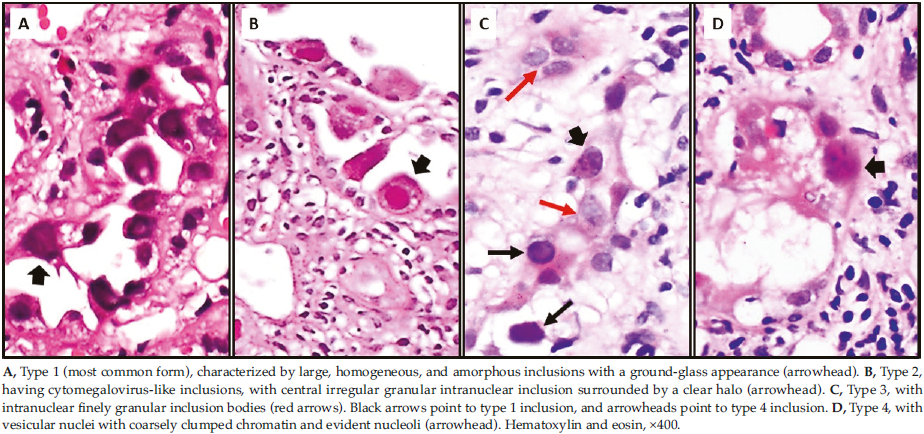
Figure 2. BK Viral Replication in Tubular and Bowman Epithelium Can Generate Various Nuclear Alterations
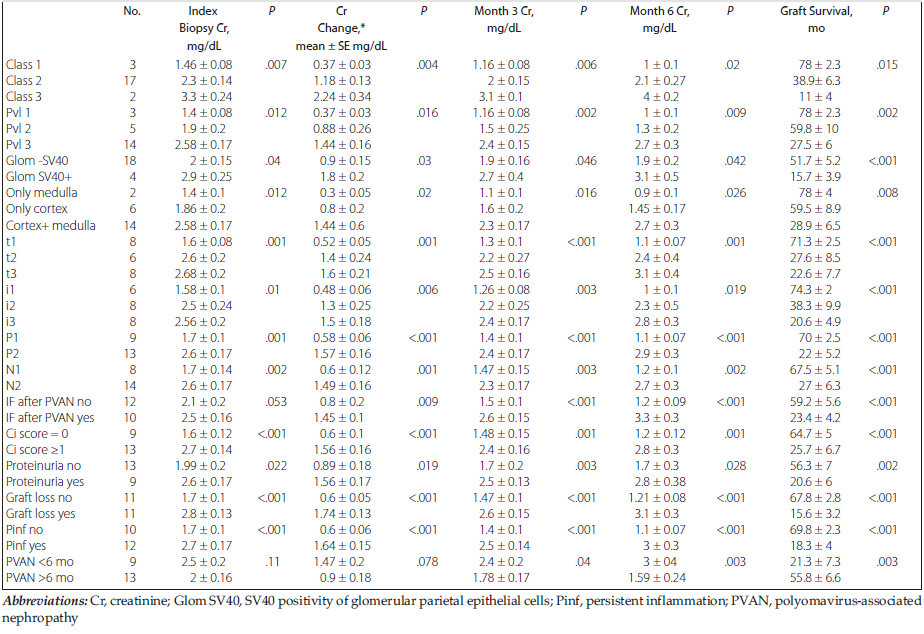
Table 3. Correlation of Clinicopathologic Parameters With Serum Creatinine Levels at Time of Index Biopsy, Change in Creatinine, Month 3 and 6 Follow-Up Serum Creatinine, and Graft Survival
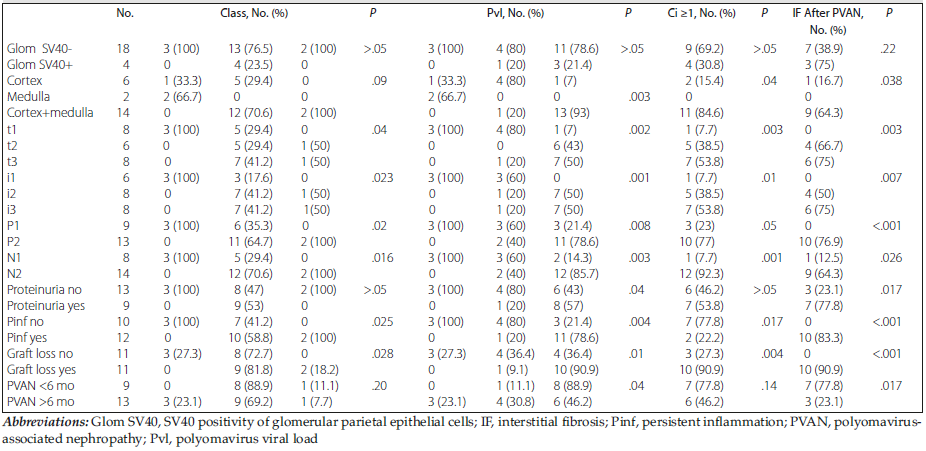
Table 4. Correlation of Clinicopathologic Parameters With PVANClass, Pvl, Ci Score of Index Biopsy, and Development of Diffuse Interstitial Fibrosis (IF) in Follow-up Biopsies