Volume: 18 Issue: 1 February 2020
FULL TEXT
Objectives: In this study, we aimed to investigate the pathologic and ultrastructural changes in transplanted mouse livers after different durations of cold storage by testing indicators of liver function and energy metabolism. We aimed to describe the effects of cold storage on liver function and the mechanisms of cold storage damage.
Materials and Methods: We randomly placed 8-week-old male C57BL/6 mice into the following 4 groups to establish a cold-preserved mouse model of liver transplant: a normal control group and 3 cold storage groups, in which livers were stored for 4, 12, and 24 hours. Hepatic morphology, ultrastructural changes, and glycogenolysis were observed by hematoxylin and eosin staining, periodic acid-Schiff staining, and transmission electron microscopy. After different durations of cold storage, livers were reperfused with 4°C University of Wisconsin solution to obtain perfusion fluid, and alanine and aspartate aminotransferase levels were measured. Glycogen synthase, hypoxia-inducible factor-1α, Krüppel-like factor 2, and endothelial nitric oxide synthase mRNA expression levels in liver tissues were detected by real-time polymerase chain reaction, and aquaporin 8 protein expression levels in liver tissues were detected by Western blot.
Results: Hematoxylin and eosin staining and electron microscopy of liver showed signs of injury after 12 hours of cold storage, which included mainly cytoplasmic edema characterized by loose liver cell arrangement, increased hepatic sinus fissure, mitochondrial swelling, and nuclear pyknosis. Periodic acid-Schiff staining showed that glycogen content was significantly reduced, with glycogen synthase levels also reduced. Alanine aminotransferase and aspartate aminotransferase levels gradually increased with cold storage. Glycogen synthase, Krüppel-like factor 2, endothelial nitric oxide synthase, and aquaporin 8 expression levels also gradually increased in liver tissue. These levels gradually decreased, but hypoxia-inducible factor-1α increased.
Conclusions: Mouse livers showed progressive damage to structure and function during cold storage, with mitochondrial damage perhaps showing the earliest damage.
Key words : Cold storage injury, Liver transplantation, Mitochondrial injury
Introduction
Liver transplant technologies have evolved from initial animal experiments to subsequent clinical exploration to global use for more than 50 years. It has become an accepted treatment for hepatocellular carcinoma, portal cholangiocarcinoma, various end-stage liver diseases, and liver metabolic disorders.1
The liver transplant process is divided into donor organ storage and transplant reconstruction. Static cryostorage (cold storage) technologies have been the main method for liver transplant and transportation; however, ischemia and hypoxia during cold storage can lead to energy depletion of liver cells, calcium overload, acidosis, cell edema, and other injuries.2 In addition, cold storage may cause changes in the structure and function of the liver.
During cold storage, the transplanted liver should be fully perfused with organ storage solution and then placed in an environment filled with a 4℃ storage solution. With prolonged cold storage time, edema in the liver and organelles will inevitably occur.3 Aquaporin, a family of proteins that mediate the rapid transport of water molecules, is widely found on the cell membranes of mammalian tissues and organs. Aquaporin 8 (AQP8) is mainly used to improve the balance of water molecules in the intracellular environment. It is also expressed on the mitochondrial inner membrane of cells, allowing it to regulate the volume and permeability of mitochondria and affect the rate of apoptosis.4,5 Changes in AQP8 expression during cold storage of livers may affect the water regulation function of cells and mitochondria, causing cell edema.
Cold storage is the ischemic stage of the transplanted liver. The reperfusion process activates inflammatory factors and can cause severe liver damage. The primary target of cold storage and reperfusion injury is hepatic sinusoidal endothelial cells (SECs),6,7 with cold storage damaging hepatic SECs.8 Krüppel-like factor 2 (KLF2) is a mechanically sensitive transcription factor that relies on blood flow, and laminar shear forces induce its expression. This transcription factor is irreplaceable in regulating endothelial cytoskeletal structure and improving and repairing endothelial cell function.9 Its DNA-binding domain is involved in the expression and transcription of various genes. Krüppel-like factor 2 is mainly present in endothelial cells in the microcirculatory system, where the blood vessel wall is constantly exposed to blood flow. When laminar shear force forms at the branches, endothelial cells attached to the vessel wall are eventually damaged.9,10
Normal blood flow induces endothelial cell production of KLF2-induced endothelium to produce a series of vasoprotective substances, including endothelial nitric oxide synthase (eNOS), which maintains and protects normal function of endothelial cells,11 preventing inflammation. These factors plays anti-inflammatory and antithrombotic roles.12
The cold storage process also induces upregulation of another important transcription factor, hypoxia-inducible factor-1α (HIF-1α). This transcription factor plays a major regulatory role in hypoxic conditions. It is involved in the coding and regulation of more than 50 proteins, which mediate immune inflammation in a variety of physiologic or pathologic conditions in humans.13 Hypoxia-inducible factor-1α may also regulate AQP8 expression. In a liver cold storage model, it has been shown that increased HIF-1α expression may lead to decreased AQP8 expression, inhibiting the secretion of hepatic cells, making bile lipids more concentrated, and accelerating the formation of cholesterol gallstones.14
Cold storage is the initial injury process to the donor liver. Loss of liver function caused by irreversible damage of liver parenchyma after liver transplant may be related to this process.15 How to effectively reduce cold storage injury of the transplanted liver plays an important role in the long-term prognosis after liver transplant and long-term survival of grafts. However, in-depth and meticulous research studies are scarce on the pathophysiologic, structural, and functional changes that occur. Here, we established a mouse cold liver storage model to observe the structural changes to the liver during cold storage. Indicators that we used to study changes in structural function of the liver during cold storage injury included hematoxylin and eosin (HE) staining and electron microscopy and measurement of the liver function enzymes aspartate aminotransferase (AST) and alanine aminotransferase (ALT). We also observed hepatic glycogen synthesis and decomposition to comprehensively reveal damage to structure and function during cold storage of the transplanted liver.
Materials and Methods
Materials
Twenty 8-week-old C57BL/6 mice were provided by the SPF Animal Experiment Center
of Dalian Medical University (Liaoning Province, China; experimental unit
license no. SYXK, 2013-0006). Pentobarbital sodium was bought from GuangZhou
chemical reagent factory (Guangzhou, China). RNAprep pure issue kit (DP431) was
bought from TianGen Biotech (Beijing, China), Glucose and sodium chloride were
bought from China Otsuka Pharmaceutical (Tianjin, China). Heparin sodium was
bought from Solarbio Life Science (Beijing, China). University of Wisconsin (UW)
solution was bought from Bristol-Myers Squibb (New York, NY, USA). Rabbit
polyclonal antibody to AQP8 (ab203682) was bought from Abcam (Shanghai, China).
We purchased the ALT, AST, and periodic acid-Schiff (PAS) glycogen staining kits
from Nanjing Jiancheng Bioengineering Institute (Nanjing, China). The
malonaldehyde kit was purchased from Solarbio Life Science (Beijing, China). All
primers were purchased from Takara (Shiga, Japan) and are shown in Table 1.
The mobile hole-type shadow-less lamp was from ShangHai HuiFeng Medical Instrument (Shanghai, China), the Kent ventilator was from Kent Scientific Corporation (Torrington, CT, USA), SSW-3X microsurgical instruments were from the Shanghai Medical Instruments (Shanghai, China), closed venous and 24-gauge in-dwelling needles were from Becton-Dickinson (Franklin Lakes, NJ, USA), the Leica-DM 4000B Intelligent biological microscope was from Leica (Solms, Germany), the Tecnai Spirit 120KV transmission electron microscope was from FEI Company (Hillsboro, OR, USA), and the Western blot system was from Bio-Rad (Hercules, CA, USA).
Mouse groups
We placed 20 male C57BL/6 mice into 4 groups with 5 mice in each group: a
control group in which the liver was rapidly excised after administration of
intraperitoneal anesthesia and 3 cold storage groups. For the cold storage
groups, the mouse abdomen was opened and the duodenum gently turned outward to
expose the portal vein. The abdominal aorta was ligated below the diaphragm. The
portal vein was punctured with a 24-gauge intravenous in-dwelling needle. The
liver surface was covered with ice chips made of UW solution, and then the liver
was perfused with 4°C UW solution at 30 mL/h. The posterior vena cava was cut
off after perfusion. Perfusion was stopped when the liver turned yellowish and
bloodless fluid flowed out of the outflow tract. Finally, the livers were
acquired and cold stored for 4, 12, and 24 hours (CS4h, CS12h, and CS24h
groups).
Liver specimens and experiments
Liver tissues were fixed in 10% neutral buffered formalin for 24 to 48 hours and
dehydrated with alcohol. After transparency of xylene, livers were paraffin
embedded, precooled, sliced to 3 to 4 μm thicknesses, and dewaxed with water.
Liver samples were observed after HE staining.
Excised liver samples were fixed in 2.5% glutaraldehyde for 24 to 48 hours. The samples underwent 3 washes for 10 minutes with 0.1 mmol/L phosphate-buffered saline, fixation for 2 hours with osmic acid, and 2 washes with 0.1 mmol/L phosphate-buffered saline for 10 minutes. Samples were then dehydrated with alcohol and soaked in 2 solutions supplemented with propylene oxide and epoxy resin with ratios of 1:1 and 1:2, respectively, for 4 to 6 hours. After samples were soaked overnight with pure resin, they were embedded with epoxy resin and placed in different ovens for 24 hours with temperatures of 37°C, 45°C, and 60°C for polymerization. The excised samples were cut into 50-nm ultramicrocuts using a microtome and subjected to double electron staining using uranium acetate and lead citrate. The samples were observed and photographed under a transmission electron microscope.
Tissues were ground in liquid nitrogen. For each 30 to 50 mg of tissue, 1 mL of lysate was added for homogenization. Tissues were then placed in room temperature for 5 minutes and centrifuged at 12 000 revolutions/min (rpm) at 4°C for 5 minutes. The supernatant was extracted and placed into a new ribonuclease-free centrifuge tube. After 200 μL of chloroform was added, the supernatant was oscillated for 15 seconds, placed in room temperature for 15 minutes, and centrifuged at 12 000 rpm at 4°C for 5 minutes. Samples were separated into 3 layers: yellow organic phase, interlayer water layer, and transparent water layer. The water layer was placed into a new tube and diluted with transfer fluid. Absolute ethanol was slowly added at a volume 1.5 times more than that of the transfer fluid. The mixture was then placed into the adsorption column and centrifuged at 12 000 rpm at room temperature for 30 seconds. After centrifugation, the resulting effluent liquid was discarded. We added 500 μL of protein liquid to the solution, placed it in room temperature for 2 minutes, and centrifuged it at 12 000 rpm for 30 seconds. The discharged liquid was discarded. After we added 600 μL of buffer, the solution was placed in room temperature for 2 minutes and centrifuged at 12 000 rpm for 30 seconds. The aforementioned procedures were repeated. The adsorption column was then placed into collecting tubes and centrifuged for 1 minute at 12 000 rpm in room temperature. The remaining solution was discarded, the adsorption column was placed into a new 1.5-mL ribonuclease-free centrifuge tube, and 30 to 100 μL of ribonuclease-free double-distilled H2O was added. The solution was then centrifuged at 12 000 rpm in room temperature for 2 minutes.
For reverse transcription of RNA, we followed the kit instructions. For the quantitative real time-polymerase chain reaction (PCR) experiments, we also followed the kit instructions, with glyceraldehyde 3-phosphate dehydrogenase used for reference. Primer messages are presented in Table 1.
We used Western blot analysis to measure AQP8 protein levels and the bicinchoninic acid (BCA) assay to determine protein concentrations. Protein samples were prepared using 100 mg of excised liver tissue, in which a mixture of phenylmethyl sulfonyl fluoride and RIPA lysate were added, and homogenized. The mixture was ultracentrifuged for 1 minute. After centrifugation at 4°C for 10 another minutes at 12 000 rpm, the supernatant was separated into 2 parts: 1 part for the BCA assay and 1 part that was mixed with loading buffer 5 times at a rate of 4:1 volume. Samples were heated at 100°C for 5 minutes and then immediately placed in an ice bath and stored at -20°C in preparation for sodium dodecyl sulfate-polyacrylamide gel electrophoresis.
Liver tissue was ground into liquid nitrogen and used as homogenates. A cocktail was added with a strong RIPA lysate for several minutes, and the cell was split for 30 minutes in 4°C. Total tissue protein was obtained after centrifugation at 13 000 rpm for 20 minutes. We used β-actin as reference to determine the amount of protein with BCA kits, and protein samples were separated by 10% sodium dodecyl sulfate-polyacrylamide gel electrophoresis. We proceeded with wet transfer for 50 minutes, combined the samples with an antibody, intensified the color with BCL chromogenic luminescence, and scanned and analyzed with ultraviolet radiation.
For AQP8 experiments, the first antibody was rabbit polyclonal antibody at 1:1000 (vol/vol) dilution, and the second antibody was a goat anti-rabbit immunoglobulin G (IgG) labeled with horseradish peroxidase at 1:5000 (vol/vol) dilution.
For β-actin experiments, the first antibody was mouse monoclonal antibody at 1:1000 (vol/vol) dilution, and the second antibody was goat anti-mouse immunoglobulin G labeled with horseradish peroxidase at 1:10 000 (vol/vol) dilution.
Statistical analyses
Differences in measurement data were compared with one-way analysis of variance,
and differences between groups were measured by t tests.
Results
Pathologic and morphologic changes in transplanted mouse liver after cold
storage injury
Liver specimens were sliced and then observed by HE staining. Light microscopy
results are shown in Figure 1. As shown in Figure 1A, the liver lobule structure
for the normal control group was clear, and the hepatic cell line had a regular
arrangement. Hepatocytes, central vein, and sinusoids all were normal. Figure 1B
shows the CS4h group, with hepatic sinusoidal fissure increased slightly
compared with the normal control group and the central vein structure remaining
basically intact. As shown in Figure 1C, there was no obvious difference after
12 hours of cold storage, although some hepatocytes showed edema in the
cytoplasm, there was loose arrangement and staining, and hepatic sinus fissures
were increased and more obvious than before. After 24 hours of cold storage
(Figure 1D), cytoplasmic edema of hepatocytes was severe, arrangement of the
liver plate was disordered, original shape was lost, some of the nucleus was
dissolved and broken, and the hepatic sinus fissure was more serious.
Ultrastructural changes of mouse liver during cold storage
Ultrastructural changes in hepatocyte nuclei during different durations of cold
storage
Transmission electron microscopy results are shown in Figure 2. Figure 2A shows
results for the normal control group, including liver cell nuclear shape,
nuclear membrane integrity, and clear nucleoli. As shown in Figure 2B, after 4
hours of cold storage, the basic morphology of hepatocyte nuclei did not change
significantly. After 12 hours of cold storage (Figure 2C), the hepatocyte
nucleus was irregular, and there was shrinkage and chromatin condensed in
margins. After 24 hours of cold storage (Figure 2D), the hepatocyte nucleus was
condensed, and the original spherical morphology was lost. The chromosomes were
collected, and some of the nucleus showed pyknosis and the nucleolus
disappeared.
Ultrastructural changes of hepatocyte mitochondria during different durations
of cold storage
Transmission electron microscopy results are shown in Figure 3. As shown in
Figure 3A, mitochondrial structure of the control group was basically normal,
the adventitia was intact, and the matrix density was uniform. In the CS4h group
(Figure 3B), the mitochondria showed mild swelling and the matrix became light.
In the CS12h group (Figure 3C), the mitochondria were moderately swollen, the
inner chamber was dilated, the volume was increased, the matrix electron density
became low, the color was light or even vacuolized, and the sputum was shortened
to the edge or fractured. Figure 3D (CS24h group) shows that the mitochondria
developed severe swelling and the volume increased significantly in the form of
long rods. The sputum disappeared and dissolved, the outer membrane was
blurred, and some membranes were ruptured.
Ultrastructural changes of hepatic sinusoidal endothelial cells during different
durations of cold storage
Transmission electron microscopy results are shown in Figure 4. As shown in
Figure 4A, the blood sinus cavity of the normal control group contained blood,
and the endothelial cells were flat and the microvilli were closely arranged.
After 4 hours of cold storage (Figure 4B), the endothelial cells remained intact
and did not fall off, and the microvilli did not break. After 12 hours of cold
storage (Figure 4C), the endothelial cells remained intact and showed no
shedding and the microvilli did not break. However, after 24 hours of cold
storage (Figure 4D), the endothelial cells were obviously edematous, and a large
number of vacuoles were formed in the cytoplasm. Autophagosomes were observed,
and the membrane structure of the endothelial cells was incomplete and changed
to varying degrees.
Changes in glycogen staining of mouse liver slices and expression of glycogen
synthase mRNA in mouse liver tissue during cold storage
Mouse liver section glycogen staining during cold storage
Prepared liver sections were stained with glycogen (PAS staining). The PAS
staining results are shown in Figure 5. As shown in Figure 5A, the normal
control group showed dark pink particles, which are
hepatic glycogen. As storage time extended from
4 to 24 hours, the dark pink particle staining was reduced compared with the
normal control group. Although the positive rate of PAS was decreased,
no significant differences were found among the CS4h, CS12h, and CS24h groups
(Figure 5B, 5C,
and 5D).
Expression of glycogen synthase mRNA in mouse liver tissue
Real-time PCR results of glycogen synthase are shown in Figure 6. Compared with
the normal control group, mRNA expression of glycogen synthase was significantly
reduced in the CS4h, CS12h, and CS24h groups (P < .05 and P < .01). In addition,
compared with that shown in the CS4h group, mRNA expression of glycogen synthase
in the liver was significantly reduced after cold storage for 12 hours (CS12h
group) and 24 hours (CS24h group) (P < .05).
Changes in the expression of AQP8 protein in mouse liver during cold storage
As shown in Figure 7, Western blot analyses indicated that AQP8 protein
expression in mouse liver significantly decreased during cold storage
(P < .05 and P < .01) compared with that shown in the normal control group, with
AQP8 protein expression significantly decreased with long
storage compared with cold storage for 4 hours
(P < .05).
Changes in alanine aminotransferase and aspartate aminotransferase in effluent
of mouse liver cold reperfusion
As shown in Figure 8, ALT activity in the reperfusion of mice was significantly
increased after 24 hours of cold storage compared with after 4 hours of cold
storage, with expression level about 3 times that shown with 4 hours of cold
storage (P < .05). Compared with cold storage for 4 hours, AST activity was also
significantly increased after cold storage for 12 and 24 hours (P < .05 and
P <
.01).
Changes in expression of Krüppel-like factor 2 and downstream endothelial nitric
oxide synthase in mouse liver during cold storage
Changes in Krüppel-like factor 2 mRNA level expression levels
Real-time PCR results of KLF2 are shown in Figure 9. Compared with the normal
control group, cold storage for 4, 12, and 24 hours resulted in decreased mRNA
expression of KLF2 in the liver (P < .05 and P < .001). mRNA expression of KLF2 in the liver was significantly decreased in
the CS12h group (P < .05) and the CS24h group (P < .01) versus that shown in the
CS4h group.
Changes in endothelial nitric oxide synthase mRNA level expression levels
Real-time PCR results of eNOS are shown in Figure 10. Compared with the normal
control group, mRNA expression of eNOS decreased significantly in the CS24h
group (P < .05).
Changes in hypoxia-inducible factor-1α mRNA expression in mouse liver during
cold storage
Real-time PCR results of HIF-1α are shown in
Figure 11. Compared with that shown in the normal control group, mRNA expression
of HIF-1α did not change significantly in the CS4h and CS24h groups. When stored
for 12 hours (CS12h group), mRNA expression of HIF-1α was increased (P < .05)
compared with that shown at 4 or 24 hours of cold storage (P < .05).
Discussion
Hepatocytes are the main parenchymal cells that make up the liver. They are polyhedral and arranged in bundles of hepatic plates around the central vein. The nucleus is round and large, and some are binuclear or multinuclear, making them highly differentiated cells.16 As shown by our HE staining results, there was gradually aggravated damage of liver tissue with the prolongation of cold storage time. Hepatocytes gradually showed swelling, increased cell volume, and sinus widening. Cold storage of liver grafts may mean altering the homeostasis of the cell volume, leading to impaired function.
Our electron microscopy results indicated that, with prolongation of cold storage time, hepatocytes showed loss of original structure and vacuolization and an increase of apoptotic bodies in the cytoplasm, which can eventually lead to irreversible damage. Hepatocytes gradually showed swelling, increased cell volume, and sinus widening.
At 12 hours of cold storage, we found that hepatocytes showed unclear nuclear membrane boundaries, irregular shape, and heterochromatin edge collection. After 24 hours of cold storage, the nucleus showed pyknosis and the nucleolus disappeared. The nucleus is the most powerful and largest organelle in hepatocytes, consisting of a nuclear membrane, nucleolus, and chromatin. It contains important coding DNA and regulates the metabolic activity of hepatocytes.17 If the nucleus is severely damaged, its function will inevitably be irreversibly damaged, leading to hepatocyte apoptosis.
As the energy center of hepatocytes, mitochondria are mostly ovoid, covered in the cytoplasm, and filled with matrix. Compared with mitochondria under electron microscope in other cells, mitochondria of hepatocytes do not show obvious structure, have fluidity, and are highly dynamic and highly variable organelles. Our electron microscopy results showed that mitochondrial damage to hepatocytes gradually increased with prolonged cold storage time, showing from mild swelling to moderate swelling, lumen expansion, and even vacuolization and volume increase. Mitochondria became elongated and rod-shaped, with shortened or even absent sputum and some of the outer membrane being broken.
Because mitochondria are the energy centers of eukaryotic cells, they can generate ATP to provide energy but also require a large amount of oxygen consumption. When cells are hypoxic, cells will compensate for oxygen transport, increase glucose transport, and increase glycolysis metabolism in the process of converting oxidative phosphorylation to anaerobic glycolysis.18 We confirmed by glycogen (PAS) staining that glycogen decomposition was enhanced and glycogen content was gradually decreased with prolongation of cold storage time. In addition, glycogen synthase mRNA decreased and glycogen synthesis was also affected, further demonstrating mitochondrial damage and ATP synthesis.
The hepatic sinusoid is lined with a thin endothelium covering the microvilli of hepatic sinusoidal surface. The SECs are flat, with a slightly thickened nucleus and fewer cytoplasmic organelles. These cells play important roles in the exchange of substances between hepatic sinusoids and hepatocytes.19 We found that endothelial cells did not undergo significant damage during cold storage for 4 to 12 hours. When storage was extended to 24 hours, the endothelial cells were obviously edematous, and many vacuoles were formed in the cytoplasm. Autophagosomes appeared, with some endothelial cell membranes interrupted and deformed.
Evidence from previous studies have suggested that significant SEC injury during cold storage is an early critical event in liver ischemia-reperfusion injury, which can cause microcirculatory disorders in the graft, platelet activation, sustained vasoconstriction, and upregulation of adhesion molecules. Macrophage activation and neutrophil infiltration can lead to cell death.20-22 Although our electron microscopy results showed that endothelial cell structure did not change significantly after 4 and 12 hours of cold storage, it was impossible to judge whether the function was damaged.
Both ALT and AST are mainly distributed in hepatocytes. When necrosis occurs in liver cells, cell structure is destroyed, and ALT and AST are released into the blood, causing increased serum levels of these 2 enzymes. With increasing levels, damage to liver cells becomes more severe; levels of ALT and AST are commonly used as indicators to detect liver function in the clinic.23 With regard to their distribution in hepatocytes, ALT is mainly expressed in hepatocyte cytoplasm and AST is mainly expressed in hepatocyte mitochondria. The specific damage site of hepatocytes can be judged according to the degree of elevation of both.24 We found that, with prolongation of cold storage time, expression of ALT and AST in the perfusate increased and expression of AST increased significantly, indicating that hepatocyte membrane and mitochondria were destroyed and permeability was increased. These results were further confirmed by transmission electron microscopy.
Aquaporin 8 is a novel protein that was recently found to be a transmembrane transporter. It is widely expressed in the liver and is involved in the development of various physiologic and pathologic processes in the liver and in the development of hepatobiliary diseases.25 Aquaporin 8 is expressed on the mitochondria, smooth endoplasmic reticulum near the glycogen granules, apical vesicles, and microtubules.26 Hepatocyte hydration (ie, volume) changes are dynamic, rapid processes that are affected by changes in nutrients and oxidative stress; more importantly, fluctuations in cellular hydration alter cell volume, as independent and powerful signals regulate hepatocyte metabolism and gene expression.27 In a study of acute liver injury caused by sepsis, researchers found that, with the severity of sepsis, the mitochondrial structure changed, membrane potential decreased, AQP8 protein expression decreased, and tumor necrosis factor-α increased.28 After ligustrazine was administered to protect liver mitochondria, AQP8 protein expression increased; therefore, it was suggested that AQP8 can transport water molecules on the liver mitochondrial inner membrane to improve its permeability swelling.28 Our Western blot results showed that AQP8 protein expression decreased with prolongation of cold storage time. We suggest that the changes shown in our HE results may be due to decreased expression of AQP8 protein, which reduced the ability of transporting water molecules, resulting in cell swelling and degeneration of hepatocytes under cold ischemia conditions. On the liver cell membrane, AQP8 is mostly in the form of glycosylation. The molecular weight of AQP8 protein after glycosylation is about 34 kDa, and the molecular weight of AQP8 on mitochondria is about 27 kDa.26,29,30 Therefore, our band results shown in the Western blot analyses are consistent with these previous findings.
Under normal physiologic conditions, the vascular endothelium is usually exposed to flowing blood. The endothelial cells produce KLF2 under the action of laminar shear force, which can lead to expression of proinflammatory molecules, such as endothelial cell selectin and vascular adhesion molecule 1, being down-regulated and antithrombotic molecule expression being up-regulated. In addition, activation of eNOS releases nitric oxide to exert vasoprotective effects.31 However, in the context of transplantation, endothelial cells undergo abrupt changes in hemodynamic conditions during organ storage. It is worth noting that changes in endothelial cell physiology and organ viability that stop blood flow occur early.32,33 It is still unknown whether a temporary lack of biomechanical stimulation due to refrigerated storage will cause endothelial dysfunction and reduced liver capacity. Our study showed that KLF2 expression was reduced with prolongation of cold storage time. We further verified that, when shear stress was terminated without blood flow stimulation, the KNF2-derived vasoprotective substance eNOS was down-regulated 24 hours after cold storage and endothelial cell protection decreased.
Hypoxia-inducible factor 1α is widely expressed in humans and mice and is called transcriptional activity factor. Under hypoxic conditions, HIF-1α expression is increased; this factor is involved in various physiologic responses of ischemia and hypoxia.34 To date, HIF-1α has been shown to regulate more than 50 genes, controlling angio-genesis, oxygen transport, glucose metabolism, vascular tone, cell proliferation, and survival.35 It is a heterodimeric protein composed of α and β subunits. Under normal oxygen conditions, the α subunit is targeted to be degraded by proline hydroxylase, which enables specific proline. Residues are degraded by von Hippel-Lindau polyubiquitination, and the transcriptional activity of HIF-1α is also regulated by the HIF-1 inhibitor factor. This factor also regulates the activity of the C-terminal anti-activation domain by aspartyl hydroxylation. Under hypoxic conditions, proline hydroxylase and the HIF-1 inhibitor factor are inhibited such that the α subunit is heteromeric with the β subunit and a synergistic activator is recruited to the hypoxia response element. Once oxygen is restored, the HIF-1α signal is also rapidly turned off.36,37
Hypoxia-inducible factor 1α is expressed in different organs, including brain,38 heart,39 liver,40 and kidney.41 Recently, up-regulation of HIF-1α was found to protect the liver from ischemia-reperfusion injury.42,43 Our real-time PCR results showed that HIF-1α in mouse liver tissue did not change significantly after 4 hours of cold storage, but expression increased significantly after 12 hours of cold storage. It may be that HIF-1α is activated and begins to function. After 24 hours of cold storage, HIF-1α expression is again decreased. The optimal cold storage time of the liver was 12 hours, and the expression of HIF-1α peaked. Our electron microscopy results of endothelial cells showed that KLF2 continued to decrease at 12 hours of cold storage, although the endothelial cells and surrounding microvilli structure did not. Apparent damage may indicate that HIF-1α regulates the expression of downstream eNOS gene within 12 hours, so that eNOS expression is maintained at a certain level, which plays a role in the protection of liver endothelial cells.
Conclusions
In our mouse liver cold storage model, we found that hepatocyte, mitochondria, nucleus, and endothelial cell damage gradually increased with prolongation of cold storage time. Mitochondrial damage may be the first site, leading to AST and ALT release. Mass production of free radicals leads to lipid peroxidation and increased malonaldehyde expression. As hepatic glycogen synthesis becomes impaired, compensatory enhancement of decomposition provides its energy metabolism.
Interruption of blood flow during cold storage resulted in down-regulation of the transcription factor KLF2 and its downstream vascular protective product eNOS, causing endothelial cell damage. At the same time, low temperature, hypoxia, and mitochondrial damage led to up-regulation of HIF-1α, causing eNOS to maintain normal levels in a short period of time, which may play an important role in the protection of endothelial cells in cold ischemia injury. At the same time, we found that down-regulation of AQP8 protein expression directly led to the occurrence of hepatocyte edema and mitochondrial membrane potential instability during cold storage. The regulatory relationship between AQP8 and HIF-1α needs further clarification in future experiments.
References:
- Nicolas CT, Hickey RD, Chen HS, et al. Concise review: liver regenerative medicine: from hepatocyte transplantation to bioartificial livers and bioengineered grafts. Stem Cells. 2017;35(1):42-50.
CrossRef - PubMed - Nigmet Y, Hata K, Tamaki I, et al. Human atrial natriuretic peptide in cold storage of donation after circulatory death rat livers: an old but new agent for protecting vascular endothelia? Transplantation. 2019;103(3):512-521.
CrossRef - PubMed - Garcia-Gil FA, Serrano MT, Fuentes-Broto L, et al. Celsior versus University of Wisconsin preserving solutions for liver transplantation: postreperfusion syndrome and outcome of a 5-year prospective randomized controlled study. World J Surg. 2011;35(7):1598-1607.
CrossRef - PubMed - Verkman AS, Anderson MO, Papadopoulos MC. Aquaporins: important but elusive drug targets. Nat Rev Drug Discov. 2014;13(4):259-277.
CrossRef - PubMed - Calamita G, Ferri D, Gena P, et al. The inner mitochondrial membrane has aquaporin-8 water channels and is highly permeable to water. J Biol Chem. 2005;280(17):17149-17153.
CrossRef - PubMed - Huet PM, Nagaoka MR, Desbiens G, et al. Sinusoidal endothelial cell and hepatocyte death following cold ischemia-warm reperfusion of the rat liver. Hepatology. 2004;39(4):1110-1119.
CrossRef - PubMed - Theruvath TP, Zhong Z, Currin RT, Ramshesh VK, Lemasters JJ. Endothelial nitric oxide synthase protects transplanted mouse livers against storage/reperfusion injury: Role of vasodilatory and innate immunity pathways. Transplant Proc. 2006;38(10):3351-3357.
CrossRef - PubMed - McKeown CM, Edwards V, Phillips MJ, Harvey PR, Petrunka CN, Strasberg SM. Sinusoidal lining cell damage: the critical injury in cold preservation of liver allografts in the rat. Transplantation. 1988;46(2):178-191.
CrossRef - PubMed - Bieker JJ. Kruppel-like factors: three fingers in many pies. J Biol Chem. 2001;276(37):34355-34358.
CrossRef - PubMed - Miller IJ, Bieker JJ. A novel, erythroid cell-specific murine transcription factor that binds to the CACCC element and is related to the Kruppel family of nuclear proteins. Mol Cell Biol. 1993;13(5):2776-2786.
CrossRef - PubMed - Wani MA, Conkright MD, Jeffries S, Hughes MJ, Lingrel JB. cDNA isolation, genomic structure, regulation, and chromosomal localization of human lung Kruppel-like factor. Genomics. 1999;60(1):78-86.
CrossRef - PubMed - Novodvorsky P, Chico TJ. The role of the transcription factor KLF2 in vascular development and disease. Prog Mol Biol Transl Sci. 2014;124:155-188.
CrossRef - PubMed - Wang GL, Jiang BH, Rue EA, Semenza GL. Hypoxia-inducible factor 1 is a basic-helix-loop-helix-PAS heterodimer regulated by cellular O2 tension. Proc Natl Acad Sci U S A. 1995;92(12):5510-5514.
CrossRef - PubMed - Asai Y, Yamada T, Tsukita S, et al. Activation of the hypoxia inducible factor 1alpha subunit pathway in steatotic liver contributes to formation of cholesterol gallstones. Gastroenterology. 2017;152(6):1521-1535 e1528.
CrossRef - PubMed - Zhang Y, Bie P, Shi CX. [Altered expression of mitochondrial DNA encoding ATP 6, 8 and encoding protein in energy metabolism during cold preservation and reperfusion injury in rat liver transplantation]. Zhonghua Yi Xue Za Zhi. 2010;90(10):708-711.
- Hu C, Li L. Pre-conditions for eliminating mitochondrial dysfunction and maintaining liver function after hepatic ischaemia reperfusion. J Cell Mol Med. 2017;21(9):1719-1731.
CrossRef - PubMed - Brasch K, Peters KE. Nuclear protein, matrix and structural changes in rooster liver after estrogenic induction of vitellogenesis. Biol Cell. 1985;54(2):109-121.
CrossRef - PubMed - Li P, Zhang D, Shen L, et al. Redox homeostasis protects mitochondria through accelerating ROS conversion to enhance hypoxia resistance in cancer cells. Sci Rep. 2016;6:22831.
CrossRef - PubMed - Sorensen KK, Simon-Santamaria J, McCuskey RS, Smedsrod B. Liver sinusoidal endothelial cells. Compr Physiol. 2015;5(4):1751-1774.
CrossRef - PubMed - Ikeda T, Yanaga K, Kishikawa K, Kakizoe S, Shimada M, Sugimachi K. Ischemic injury in liver transplantation: difference in injury sites between warm and cold ischemia in rats. Hepatology. 1992;16(2):454-461.
CrossRef - PubMed - Selzner N, Rudiger H, Graf R, Clavien PA. Protective strategies against ischemic injury of the liver. Gastroenterology. 2003;125(3):917-936.
CrossRef - PubMed - Jaeschke H. Molecular mechanisms of hepatic ischemia-reperfusion injury and preconditioning. Am J Physiol Gastrointest Liver Physiol. 2003;284(1):G15-26.
CrossRef - PubMed - Roman P, Budzinski G, Suszka-Switek A, et al. Caspase-3 expression and ALT, AST, and GGT activity after 24 hours of porcine liver cold storage, depending on the type of transgenesis. Transplant Proc. 2016;48(5):1829-1832.
CrossRef - PubMed - Lai X, Gong J, Wang W, et al. Acetyl-3-aminoethyl salicylate ameliorates hepatic ischemia/reperfusion injury and liver graft survival through a high-mobility group box 1/toll-like receptor 4-dependent mechanism. Liver Transpl. 2019;25(8):1220-1232.
CrossRef - PubMed - Zhao GX, Dong PP, Peng R, et al. Expression, localization and possible functions of aquaporins 3 and 8 in rat digestive system. Biotech Histochem. 2016;91(4):269-276.
CrossRef - PubMed - Calamita G, Mazzone A, Bizzoca A, et al. Expression and immunolocalization of the aquaporin-8 water channel in rat gastrointestinal tract. Eur J Cell Biol. 2001;80(11):711-719.
CrossRef - PubMed - Haussinger D, Schliess F, Warskulat U, vom Dahl S. Liver cell hydration. Cell Biol Toxicol. 1997;13(4-5):275-287.
CrossRef - PubMed - Wang JQ, Zhang L, Tao XG, et al. Tetramethylpyrazine upregulates the aquaporin 8 expression of hepatocellular mitochondria in septic rats. J Surg Res. 2013;185(1):286-293.
CrossRef - PubMed - Garcia F, Kierbel A, Larocca MC, et al. The water channel aquaporin-8 is mainly intracellular in rat hepatocytes, and its plasma membrane insertion is stimulated by cyclic AMP. J Biol Chem. 2001;276(15):12147-12152.
CrossRef - PubMed - Elkjaer ML, Nejsum LN, Gresz V, et al. Immunolocalization of aquaporin-8 in rat kidney, gastrointestinal tract, testis, and airways. Am J Physiol Renal Physiol. 2001;281(6):F1047-1057.
CrossRef - PubMed - Gracia-Sancho J, Villarreal G, Jr., Zhang Y, et al. Flow cessation triggers endothelial dysfunction during organ cold storage conditions: strategies for pharmacologic intervention. Transplantation. 2010;90(2):142-149.
CrossRef - PubMed - Belzer FO, Ashby BS, Gulyassy PF, Powell M. Successful seventeen-hour preservation and transplantation of human-cadaver kidney. N Engl J Med. 1968;278(11):608-610.
CrossRef - PubMed - Peralta C, Closa D, Hotter G, Gelpi E, Prats N, Rosello-Catafau J. Liver ischemic preconditioning is mediated by the inhibitory action of nitric oxide on endothelin. Biochem Biophys Res Commun. 1996;229(1):264-270.
CrossRef - PubMed - Huang Y, Hickey RP, Yeh JL, et al. Cardiac myocyte-specific HIF-1alpha deletion alters vascularization, energy availability, calcium flux, and contractility in the normoxic heart. FASEB J. 2004;18(10):1138-1140.
CrossRef - PubMed - Yee Koh M, Spivak-Kroizman TR, Powis G. HIF-1 regulation: not so easy come, easy go. Trends Biochem Sci. 2008;33(11):526-534.
CrossRef - PubMed - Akhtar MZ, Sutherland AI, Huang H, Ploeg RJ, Pugh CW. The role of hypoxia-inducible factors in organ donation and transplantation: the current perspective and future opportunities. Am J Transplant. 2014;14(7):1481-1487.
CrossRef - PubMed - Semenza GL. Oxygen sensing, homeostasis, and disease. N Engl J Med. 2011;365(6):537-547.
CrossRef - PubMed - Baranova O, Miranda LF, Pichiule P, Dragatsis I, Johnson RS, Chavez JC. Neuron-specific inactivation of the hypoxia inducible factor 1 alpha increases brain injury in a mouse model of transient focal cerebral ischemia. J Neurosci. 2007;27(23):6320-6332.
CrossRef - PubMed - Adluri RS, Thirunavukkarasu M, Dunna NR, et al. Disruption of hypoxia-inducible transcription factor-prolyl hydroxylase domain-1 (PHD-1-/-) attenuates ex vivo myocardial ischemia/reperfusion injury through hypoxia-inducible factor-1alpha transcription factor and its target genes in mice. Antioxid Redox Signal. 2011;15(7):1789-1797.
CrossRef - PubMed - Guo Y, Yang T, Lu J, et al. Rb1 postconditioning attenuates liver warm ischemia-reperfusion injury through ROS-NO-HIF pathway. Life Sci. 2011;88(13-14):598-605.
CrossRef - PubMed - Weidemann A, Bernhardt WM, Klanke B, et al. HIF activation protects from acute kidney injury. J Am Soc Nephrol. 2008;19(3):486-494.
CrossRef - PubMed - Guo Y, Feng L, Zhou Y, et al. Systematic review with meta-analysis: HIF-1alpha attenuates liver ischemia-reperfusion injury. Transplant Rev (Orlando). 2015;29(3):127-134.
CrossRef - PubMed - Zaouali MA, Ben Mosbah I, Boncompagni E, et al. Hypoxia inducible factor-1alpha accumulation in steatotic liver preservation: role of nitric oxide. World J Gastroenterol. 2010;16(28):3499-3509.
CrossRef - PubMed

Volume : 18
Issue : 1
Pages : 71 - 82
DOI : 10.6002/ect.2019.0193
From the 1Dalian Medical University, Dalian, Liaoning Province, China; the
2Lianshui County People's Hospital, Huaian, Jiangsu Province, China; and the
3Dalian Port Hospital, Dalian, Liaoning Province, China
Acknowledgements: The authors have no conflicts of interest to declare and have
no commercial or associative interests that represent a conflict of interest
with this work. This work was supported by the National Natural Science
Foundation of China (81370583 and 30801127). *Liang Zhu, Shanshan Feng, Yunhong
Wu, and Jingzhou Mu contributed equally to this work..
Corresponding author: Liang Zhu or Tonghui Ma, Dalian Medical University,
Dalian, Liaoning Province, China
Phone: +86 041186110342 or +86 041186110282
E-mail: zhuliang0210@sina.com or
tonghuimadmu@163.com
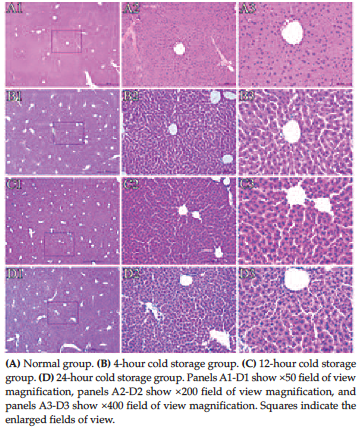
Figure 1. Liver Specimens Observed by Hematoxylin and Eosin Staining
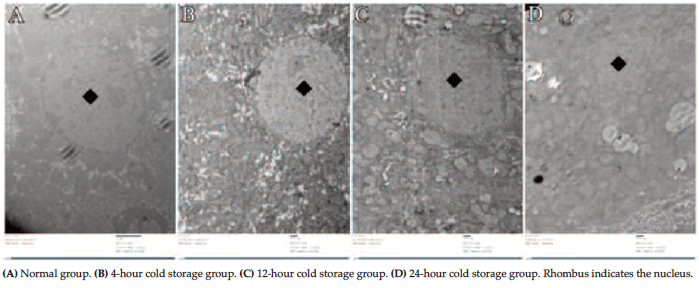
Figure 2. Hepatocyte Nuclear Transmission Electron Microscope Results (×12 000)
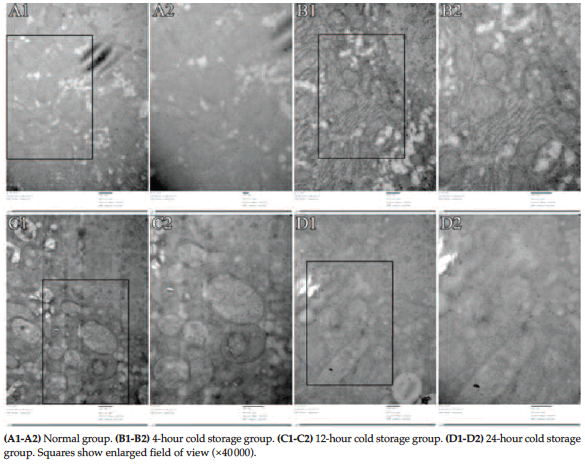
Figure 3. Hepatocyte Mitochondrial Transmission Electron Microscope Results (×25 000)
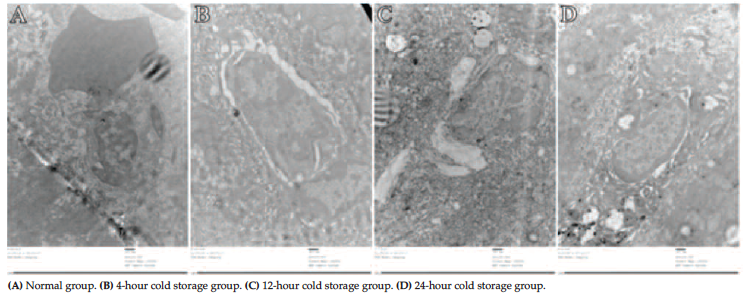
Figure 4. Hepatocyte Endothelial Cell Transmission Electron Microscopy Results (×15 000)
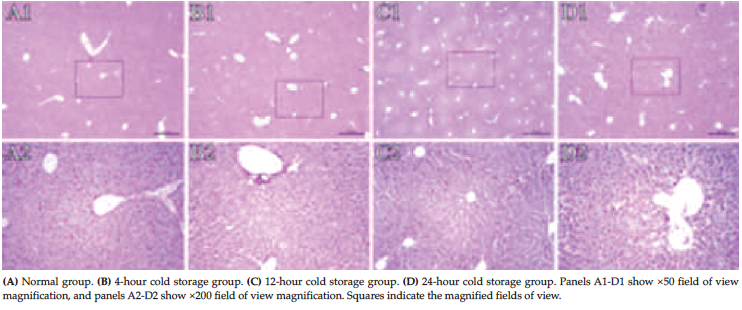
Figure 5. Mouse Liver Tissue Glycogen Staining (Periodic acid-Schiff)
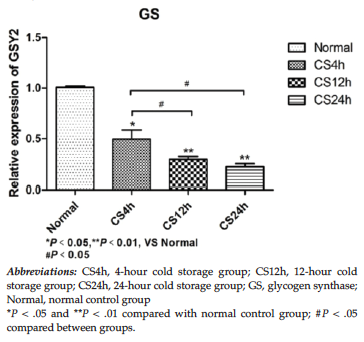
Figure 6. Changes in Glycogen Synthase mRNA Expression During Cold Storage
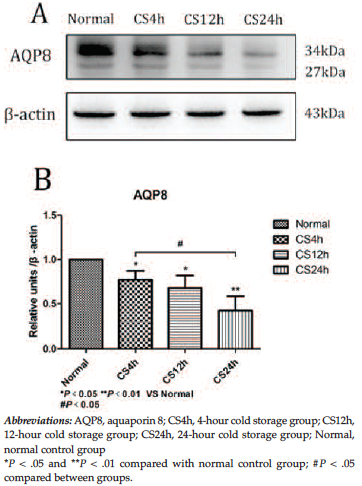
Figure 7. Changes in Aquaporin 8 Protein Expression During Cold Storage
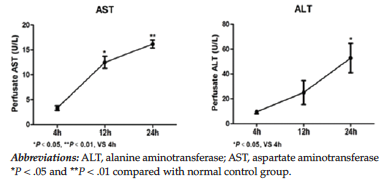
Figure 8. Changes in Transaminase Levels in Mouse Liver Effluent at Different Cold Storage Times
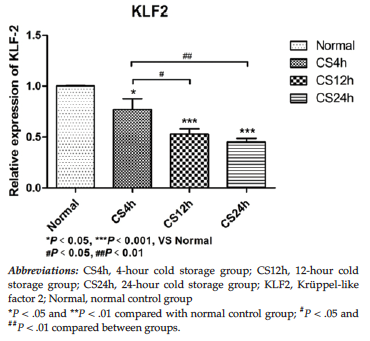
Figure 9. Changes in Krüppel-like Factor 2 mRNA Expression in Mouse Livers
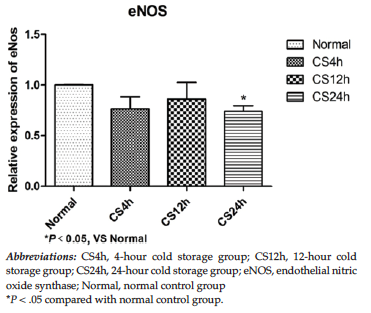 Figure 10. Changes in Endothelial Nitric Oxide Synthase mRNA
Expression in Mouse Livers" style="margin-bottom: 10px; cursor: pointer">
Figure 10. Changes in Endothelial Nitric Oxide Synthase mRNA
Expression in Mouse Livers" style="margin-bottom: 10px; cursor: pointer">
Figure 10. Changes in Endothelial Nitric Oxide Synthase mRNA Expression in Mouse Livers
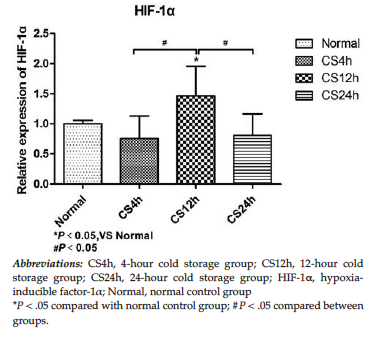
Figure 11. Changes in Hypoxia-Inducible Factor-1α mRNA Expression in Mouse Livers
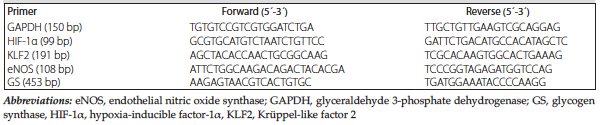
Table 1. Primers Investigated in Our Mouse Experiments