Volume: 6 Issue: 4 December 2008
FULL TEXT
Background: We sought to assess whether the single cyclosporine concentration taken 2 hours after administration (C2) is a good parameter to predict a drug’s maximal concentration (Cmax) value in Egyptian kidney transplant recipients
Materials and Methods: Fifty stable Egyptian kidney transplant recipients with a previously diagnosed schistosomal infection were compared with 50 Egyptian kidney transplant recipients without a schistosomal infection regarding cyclosporine concentrations at time 0 (trough), and then at 1.5, 2, 2.5, 3, and 3.5 hours after a dose of cyclosporine. We used a linear regression analysis to assess any statistically significant differences between the different cyclosporine time concentrations and drug dosages
Results: Patients in the schistosomal group had significantly lower C2 levels (511 ± 118 nmol/L) compared with those in the nonschistosomal (control) group (669 ± 213 nmol/L) (P < .05), whereas the C2.5 level was significantly higher (730 ± 215 and 527 ± 129 nmol/L, respectively; P < .05). A significant linear regression relation was determined for only C2.5 in the schistosomal group with both morning cyclosporine dose and cyclosporine dose expressed as mg/kg/d (P = .0123, r = .573018).
Conclusions: Egyptian patients have special characteristics with regard to drug absorption and metabolism, mostly owing to schistosomal infection, and they may need the use of C2.5 to monitor cyclosporine. If confirmed by subsequent, larger studies, our findings may have a significant effect on our understanding and management of cyclosporine immunosuppression in clinical renal transplants with persons of different ethnicities.
Key words : Cyclosporine, Cmax monitoring
Cyclosporine has been approved for use as a primary immunosuppressant agent for renal transplants for more than 20 years, and its use has resulted in a substantial improvement in clinical outcome in renal transplant recipients. However, after 20 years of experience, the optimal use and monitoring of cyclosporine has remained unclear. Numerous analyses have consistently shown that the single cyclosporine concentration taken 2 hours after administration (C2) correlates most closely with the area under the concentration-time curve (AUC0-4) both during the early and later posttransplant periods (1). However, most of these data were from white or African-American cohorts (2, 3). There presently is a paucity of data and experience regarding the use of C2 monitoring in other races and ethnicities.
In Egypt, the prevalence of bilharzial infection is high and has been shown to impair absorption of many drugs including cyclosporine (4-6). To achieve target cyclosporin blood levels, significantly greater dosages (65% ± 67% higher) are needed for recipients infected with S. mansoni than for those not infected (7). This could be due to an effect of schistosomiasis on the intestinal mucosa, which impairs the absorption of cyclosporine. Intestinal absorption of cyclosporine is irregular, with individual variability; consequently, despite advances in the formulation of cyclosporine, measurements of cyclosporine concentrations are still necessary for individual treatment adjustments.
One caveat concerning the C2 values observed is that cyclosporine-microemulsion absorption may not always be evaluated most effectively at 2 hours after dosing (8). In some patients, lower-than-targeted C2 levels, which do not appear to respond appropriately to increasing cyclosporine-microemulsion doses, may be observed. The absorption phase of cyclosporine (AUC0-4), which generally includes the maximal concentration (Cmax), is the period that displays the most pronounced intra- and interindividual variability because it is characterized by rapid changes in whole blood concentrations. This variability is due, among other reasons, to different gastrointestinal absorption properties among patients (8). In such cases, the patient might be absorbing cyclosporine-microemulsion in a “delayed” manner, implying that the highest absorption period may be beyond 2 hours. If such is the case, it may be more appropriate to assess exposure at a later time after dosing, for example, at 4 hours (9). Obtaining a C4 measurement in a patient with a low C2 value may differentiate a low absorber from a slow absorber. The proportion of such patients and the impact on peak absorption profiling are not known yet.
Because of differences in race and genetic backgrounds, recommendations of C2 concentrations from a white population may not be appropriate for Egyptian populations. The aims of this study were to assess the drug’s Cmax in Egyptian kidney transplant recipients with hepatosplenic schistosomal infection and determine whether the C2 level is a good parameter to predict Cmax values to determine the optimal therapeutic window in this population.
Patients and Methods
The study was done with 100 kidney recipients (71 men, 29 women; mean age at transplant, 40.8 ± 8.1 and 38.6 ± 8.4 years), more than 3 months after the transplant (Table 1). Each patient provided written, informed consent. The study protocol is in accordance with the Declaration of Helsinki (1964) and was approved by the Ethics Research Committee of the local authorities. Patients were divided into 2 groups according to a definitive diagnosis of hepatosplenic schistosomal infection (schistosomal group; n=50) and those without the infection (nonschistosomal group; n=50). The diagnosis of hepatosplenic schistosomiasis had been made using clinical criteria and confirmation by a stool analysis that had been positive for
S. mansoni eggs, a rectal mucosal biopsy that had detected S. mansoni
eggs, and an indirect hemagglutination assay that detected antischistosomal antibodies (9).
Patients had stable organ function (no proteinuria and creatinine levels less than 170 µmol/L ) and were treated with prednisone, azathioprine, and cyclosporine. Cyclosporine was administered twice a day and prescribed to achieve a basal cyclosporine concentration (C0) between 125 and 150 µg/L. Patients were not taking cytochrome P-450–interfering drugs. Blood samples obtained on the study day were taken at time 0 (basal), and then 1.5, 2, 2.5, 3, and 3.5 hours after cyclosporine intake. Cyclosporine was measured in whole blood by monoclonal antibodies (Abbott cyclosporine assay, fluorescence polarization immunoassay, Abbott Laboratories, Abbott Park, IL, USA) establishing and validating a dilution protocol. The following data were analyzed: age, sex, body weight, body mass index, time of follow-up after transplant, morning cyclosporine dose, daily cyclosporine dosage, cyclosporine dosage expressed as mg/kg/d, cyclosporine concentration at different times (C0, C1,5, C2, C2,5, C3, C3,5), and serum creatinine level µmol/L). Subsequently, a relation between C0, C1,5, C2, and C2,5 with morning dose, total daily dosage, and dosage expressed as mg/kg/d was studied.
We used the t test to compare the mean values of the continuous parameters between patients in different groups, the chi-square test for qualitative variables, and a regression analysis to correlate quantitative parameters. Statistical significance of linear regression between different cyclosporine time concentrations and drug dosages was calculated. Correlations (r) were examined by linear regression analysis. Values for P less than .05 were considered statistically significant.
Results
Table 1 shows that patients in both groups were homogeneously assigned to the groups. The mean level of C0 in the schistosomal and nonschistosomal groups was 113 ± 30 and 112 ± 27 nmol/L, respectively (P = NS) (Table 2). Twenty-six percent of the patients in the schistosomal group had C0 values of 100 nmol/L or less, while only 24 of the patients in the nonschistosomal group did. As for the C2 levels, 46% and 27% were between 250 and 500 nmol/L in the schistosomal and nonschistosomal groups, respectively (P = .01). In addition, regarding the C2,5 levels, only 33% of patients in the schistosomal group had the same values and only 66% of the patients in the nonschistosomal group did (P = .01). Patients in schistosomal group, had significantly lower C2 levels (511 ± 118 nmol/L) compared with patients in the nonschistosomal group (669 ± 213 nmol/L) (P < .05), whereas the C2,5 level was significantly higher (730 ± 215 nmol/L and 527 ± 129 nmol/L, respectively; P < .05), indicating a possible relation between low C2 levels and delayed absorption in schistosomal patients (Table 2).
Among patients receiving a mean dose of 186 mg/d in the schistosomal group, observed values of C0, C2, and C2,5 were, respectively, 113 ± 30 nmol/L, 511 ± 118 nmol/L, and 730 ± 215 nmol/L. Even when corrected for the dose (C/D), interindividual variability among this small cohort was approximately 30% (33% for C0, 29% for C2, and 24% for C2,5, respectively), while it was (29%, 33%, and 31% in the same levels, respectively) in the nonschistosomal group (Table 2). Importantly, only C2,5 (not C0, C2, C3, or C3,5) in the schistosomal group had a significant linear regression relation with both morning cyclosporine dose and cyclosporine dose expressed as mg/kg/d (P = .0123, r = .573018) (Table 4). In the nonschistosomal group, C2 had a significant linear regression relation with morning cyclosporine dose and cyclosporine dose expressed as mg/kg/d (P = .0113, r = 0.462028) (Table 3).
To explore eventual differences of this relation in various periods after transplant, C2 determinations were done in 20 recipients in both groups and were analyzed according to the different posttransplant periods: before transplant and 12 months after renal transplant. Table 4 shows that the mean C2 levels in the early posttransplant period (< 12 months) were in the expected mean level range: 187 ± 39 nmol/L (125 -300 nmol/L and 181 ± 49 nmol/L (150-300 nmol/L) in the schistosomal and the nonschistosomal groups, respectively. Mean ± SD of C2 was significantly higher in the nonschistosomal group both before and 12 months after transplant (966 ± 92 nmol/L and 696 ± 97 nmol/L , respectively). Mean ± SD of the C2,5 levels in the schistosomal group were 895 ± 98 nmol/L and 629 ± 119 nmol/L at the same intervals, respectively.
Discussion
Cyclosporine in an aqueous media produces a clear rather than an opalescent solution, obviating the need for gastrointestinal emulsification and digestion of the administered medication. While new formulations show improved and more-reproducible absorption in individual transplant patients (less intraindividual variability), they show interindividual variations similar to those of cyclosporine in oil-based preparations (10).
From a pharmacokinetics point of view, peak cyclosporine concentration depends on dosage, rate and extent of absorption, and the distribution volume of the drug. In the case of cyclosporine, a major factor influencing the peak concentration is the rate and extent of absorption. Among other factors, variations in intestinal P-glycoprotein and hepatic cytochrome P (CYP 3A4) activity are important variables that modulate cyclosporine oral bioavailability (11). These factors are mainly responsible for the intraindividual and interindividual variability of cyclosporine blood concentrations, and this variability is most pronounced during the first 4 hours after cyclosporine administration (12). This 4-hour period is associated with a large amount of intraindividual and interpatient variability and is an indicator of the patient’s ability to absorb cyclosporine from the intestine. Further, existence of a lag time is also important, considering that absorption and peak time influence the relative significance of C2 (13).
The question arises as to which single pharmacokinetics parameter of cyclosporine can be used best in clinical practice to adequately assess the absorption profile. Many investigators claim that the C2 level is the most appropriate method for posttransplant monitoring of cyclosporine, reducing the incidence of acute rejection episodes (1, 2). This study shows that that C2 and not C0 shows a significant relation with daily dosage expressed as mg/kg (or as mg/kg/d) in nonschistosomal renal transplant patients at different times after transplant management and matches many studies of different races (2, 3, 14). Nevertheless, according to our results, using the regression coefficient analysis with this method, monitoring cyclosporine with C2 is not appropriate for all recipients the Egyptian population. Obviously, this effect is due to the well-known interindividual variability of C2 level that basically represents a wide range of cyclosporine absorption.
The C2 level of cyclosporine correlated less accurately (r2 =.29) with cyclosporine dosages in the early and the late posttransplant intervals in schistosomal renal transplant recipients than it did in nonschistosomal renal transplant recipients (r2=.0113). This difference appears to be due to a more-variable time to maximal concentration (Tmax) of cyclosporine in schistosomal patients as compared with nonschistosomal patients. Hence, a single concentration taken 2 hours after cyclosporine administration (C2) may not reliably reflect the Cmax value in these patients.
The maximal concentration of cyclosporine is thought to reflect the time point of maximal calcineurin inhibition in response to cyclosporine (14, 15, 16). This line of reasoning is supported by our observation that the C2,5-cyclosporine level has significant regression coefficient values with cyclosporine dose (either morning cyclosporine or dose expressed as mg/kg/d) in the schistosomal group, and that there was no clear-cut association of C2 levels with these cyclosporine dosage values. It can thus be derived from our data that C2 levels in these schistosomal patients may be lower than expected, and that by increasing the daily cyclosporine dosages to achieve the target level may expose them to cyclosporine nephrotoxicity. Moreover, our data may provide a basis for optimization of cyclosporine therapy in patients with schistosomal infection.
Schistosomal patients may have delayed drug absorption or metabolism owing to specific liver enzymes. In 1 experimental study, the authors compared hepatic concentrations of cytochrome P-450 and microsomal protein in animals infected with S. mansoni and controls. These authors found that S. mansoni infection significantly reduced the level of the liver cytochrome P-450 enzyme, and suggested that impaired drug metabolism in the liver of infected animals may be related to possible clinical and pharmacokinetics implications in humans (6). Einecke and associates (16, 17) studied the cyclosporine absorption profiling and therapeutic drug monitoring using C2 blood levels in 130 stable renal allograft recipients and found that there were different absorption profiles among their patients, which reflects the variable pharmacokinetics of cyclosporine, and that the individual absorber status remained the same during repeated visits. The authors suggest that differences in absorption profiles play a key role in meeting the challenge of avoiding overexposure, which places patients at risk of nephrotoxicity. The authors encourage further investigation to study the effect of differences between low and high absorbers on clinical outcomes.
Despite the limitations of this small study, we conclude that using C2 monitoring in Egyptian renal transplant recipients appears to correlate with cyclosporine dosages. However, in Egyptian kidney transplant patients with schistosomal infection, a common problem in our population, there are special characteristics of drug absorption and metabolism, and these patients may need to use C2,5 monitoring instead of C2. If confirmed by subsequent, larger studies, our findings may have a significant effect on our understanding and management of cyclosporine immunosuppression in clinical renal transplants with persons of different ethnicities.
References:
- Nashan B, Cole E, Levy G, Thervet E. Clinical validation studies of Neoral C(2) monitoring: a review. Transplantation. 2002 15;73(suppl 9):S3-S11.
- Cole E, Maham N, Cardella C, et al. Clinical benefits of neoral C2 monitoring in the long-term management of renal transplant recipients. Transplantation. 2003;75(12):2086-2090.
- Emovon OE, King JA, Holt CO, Singleton B, Howell D, Browne BJ. Effect of cyclosporin pharmacokinetics on renal allograft outcome in African-Americans. Clin Transplant. 2003;17(3):206-211.
- Sheweita SA, Mubark J, Doenhofe MJ, et al. Changes in the expression of cytochrome P450 isozymes and related carcinogen metabolizing enzyme activities in Schistosoma mansoni-infected mice. J Helminthol. 2002;76(1):71-78.
- Naik YS, Hasler JA. Intensity of Schistosoma mansoni infection determines alterations in hepatic drug metabolism. J Egypt Soc Parasitol. 1995;25(1):157-163.
- Kyegombe DB, Al-Mofleh I, Al-Khuwaitir S, Mahmoud A, Al-Tuwaijri A. Effect of murine schistosomiasis on hepatic cytochrome P-450 and microsomal protein. Liver. 1986;6(3):167-172.
- Shokeir AA. Renal transplantation: the impact of schistosomiasis. BJU Int. 2001;88(9):915-920.
- Levy GA. C2 monitoring strategy for optimising cyclosporin immunosuppression from the Neoral formulation. BioDrugs. 2001;15(5):279-290.
- Johnston A, David OJ, Cooney GF. Pharmacokinetic validation of neoral absorption profiling. Transplant Proc. 2000;32(suppl 3A):53S-56S.
- Sobh MA, el-Agroudy AE, Moustafa FE, Shokeir AA, el-Shazly A, Ghoneim MA. Impact of schistosomiasis on patient and graft outcome after kidney transplantation. Nephrol Dial Transplant. 1992;7(8):858-864.
- Kahan BD, Dunn J, Fitts C, et al. Reduced inter- and intrasubject variability in cyclosporine pharmacokinetics in renal transplant recipients treated with a microemulsion formulation in conjunction with fasting, low-fat meals, or high-fat meals. Transplantation. 1995;59(4):505-511.
- Lown KS, Mayo RR, Leichtman AB, et al. Role of intestinal P-glycoprotein (mdr1) in interpatient variation in the oral bioavailability of cyclosporine. Clin Pharmacol Ther. 1997;62(3):248-260.
- Johnston A, David OJ, Cooney GF. Pharmacokinetic validation of neoral absorption profiling. Transplant Proc. 2000;32(suppl 3A):53S-56S.
- Billaud EM, Antoine C. C2 therapeutic drug monitoring of cyclosporine: sources of variability. Transplant Proc. 2002;34(7):2828-2830.
- Cole E, Midtvedt K, Johnston A, Pattison J, O'Grady C. Recommendations for the implementation of Neoral C(2) monitoring in clinical practice. Transplantation. 2002;73(suppl 9):S19-S22.
- Wong HS, Morad Z. Neoral (cyclosporine) C2 monitoring in renal transplant recipients: a single-center experience in Asia. Transplant Proc. 2003;35(1):230-231.
- Einecke G, Mai I, Diekmann F, Fritsche L, Neumayer HH, Budde K. Cyclosporine absorption profiling and therapeutic drug monitoring using C(2) blood levels in stable renal allograft recipients. Transplant Proc. 2002;34(5):1738-1739.

Volume : 6
Issue : 4
Pages : 282 - 286
From the Urology & Nephrology Center, Mansoura University, Mansoura, Egypt
Address reprint requests to: Dr. Amgad E. El-Agroudy, MD Urology & Nephrology Center, Mansoura University, Mansoura , Egypt
Phone: +20-50-2262222 Fax: +20-50-2263717 E-mail: amgadelagroudy@hotmail.com
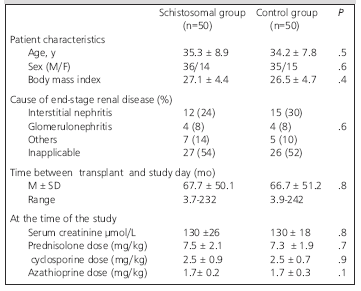
Table 1. Baseline demographics and clinical characteristics of both groups.
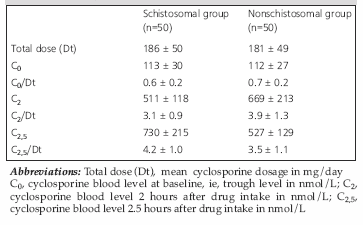
Table 2. Interindividual variations for cyclosporine concentrations (nmol/L in both groups).
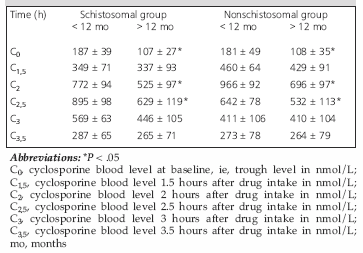
Table 3. Cyclosporine concentrations (nmol/L in both groups) according the interval after transplant.
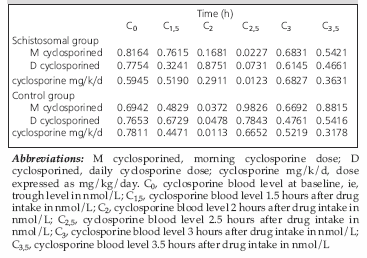
Table 4. Study of cyclosporine blood concentrations at studied times and cyclosporine dosages in both groups.