Volume: 7 Issue: 4 December 2009
FULL TEXT
Objectives: The aim of this retrospective study was to characterize the patients who experienced borderline rejection.
Materials and Methods: Patients with a minimum follow-up of 2 years were enrolled in this study. Forty-seven patients out of 106 patients with borderline rejection (after exclusion of those with associated chronic interstitial fibrosis) were compared with patients with acute cellular rejection grade 1 (n=650), and patients free of rejection episodes (n=444) regarding the different characteristics.
Results: Patients aged 20 years or younger were frequently in borderline rejection group than other groups (which was statistically significant) (P = .001). Significant differences were found in recipient and donor ages, consanguinity, pretransplant blood transfusion, and immunosuppression plan. Most patients in borderline rejection group received triple immunosuppression therapy than other groups (P = .001). Univariate and multivariate regression analysis of different variables on graft survival in borderline rejection patients revealed that none of them was statistically significant.
Conclusions: Borderline rejection is a frequent finding in biopsy-proven acute rejection after kidney transplant. Time of occurrence, frequency, treatment or not, and response to therapy were not predictors to graft survival.
Key words : Borderline changes, Kidney, Transplant
Rejection remains a significant problem following renal allotransplant, and although powerful antirejection therapy is available, its unguided use is associated with significant morbidity and mortality.
Needle core biopsy for conventional histologic examination remains the technique of choice for diagnosis of rejection (1). A series of meetings at Banff introduced an international standard for evaluation of biopsies after kidney transplant, which allowed classification of renal allograft pathology and acute rejection in particular. The goal of Banff' working classification was proposed as an attempt to devise a scheme for interpretation and gradation of histologic findings in renal allograft biopsies that can be used as an indication for therapeutic consequences and expected graft survival (2).
The Banff schema suggests the diagnostic category “borderline changes” to refer to pathologic changes insufficient for diagnosis of mild acute rejection. The reported incidence of borderline changes based on the Banff working classification ranged from 3% to 49% (3-6). In view of the natural history and clinical impact of borderline rejection, as well as long-term graft survival, a therapeutic dilemma, whether to treat or not to treat, is an area of much debate (7-10).
The aim of this study was to characterize factors, which may predispose to borderline changes in renal allograft recipients.
Patients and Methods
From December 2001 to December 2006, 437 live-donor kidney transplants were carried out. Using Banff criteria for diagnosis of acute rejection, 202 biopsies showed borderline changes out of 429 biopsies with the diagnosis of acute rejection (47%).
Study design
Patients with a minimum follow-up for 2 years
(mean ± SD, 67 ± 25 months) were enrolled in this study (106 patients). Graft
biopsies with documented histopathologic findings of calcineurin-inhibitors
nephrotoxicity, recurrent original kidney disease; de-novo glomerulonephritis or
acute tubular necrosis were excluded from this study. Forty-seven patients out
of 106 patients who had biopsy-proven borderline rejection (after exclusion of
those with associated chronic interstitial fibrosis) were compared with patients
with acute cellular rejection grade 1 (n=650) and patients with no free
rejection episodes (n=444) regarding the different characteristics and follow-up
variables, as well as graft survival.
Clinical Variables
Clinical data were obtained by reviewing patients' records and included all
pretransplant data (Table 1). Basal serum creatinine and peak levels at the time
of diagnosis were obtained for borderline rejection group.
Immunosuppression Protocols
The immunosuppressive regimens varied over the years; all patients, before 1983,
received prednisolone (2 mg/kg/d) initially with consequent tapering of dosage
until (0.5 mg/kg/d) after 1 month. This was coupled with azathioprine (2-3
mg/kg/d). After 1983, patients were given cyclosporine in doses targeting trough
whole blood of 200 - 400 ng/mL in the first 2 months after transplant and then
between 100 to 150 ng/mL, thereafter measured by RIA assay kits (Sandoz, Basal,
Switzerland) and then using monoclonal specific antibody (TDx Abbott Kits).
ATG or monoclonal antibodies (Orthoclone, OK T3) were used in high-risk group of patients. In the 1990s, tacrolimus (0.15 mg/kg/d and/or mycophenolate mofetil (1-2 mg/d) were introduced as rescue therapies. The tacrolimus dose was adjusted to achieve a trough level of 5 to 10 ng/mL.
Graft biopsies were performed under ultrasound guidance using a modified 18-gauge core cut needle mounted on a spring-loaded biopsy gun. Renal allograft biopsies were subjected to routine histopathologic examination and scored for interstitial inflammation (i), tubulitis (t) as defined by the Banff scheme (2).
Five hundred mg methylprednisolone for 3 to 5 consecutive days were given for grade 1 and 2 acute rejection and anti-thymocyte globulin or Orthoclone (OKT3) were given for grade 3 acute rejection episodes. In patients with biopsy-proven borderline rejection, treatment modalities include methylprednisolone 500 mg for 3 to 5 days; increasing basal immunosuppression using rescue therapy as tacrolimus and/or mycophenolate mofetil; or not to treat.
Statistical analysis
Statistical analyses were performed with SPSS software for Windows (Statistical
Product and Service Solutions, version 17.0, SSPS Inc, Chicago, IL, USA). For
univariate analysis, the t test and the chi square tests were used. To determine
which variable remained important risk factors after adjustment for other
variables, multivariate linear logistic regression was done. Graft actuarial
survivals were determined by the Kaplan-Meier method. Graft survival curves
using Kaplan-Meier method was used. Variables were considered significant when
P
value was < .05.
Results
Over the period between December 2001 and December 2006, 437 live-donor kidney transplants were carried out at the Urology & Nephrology Center, Mansoura, Egypt. Graft biopsies were carried out on rejection suspicion and interpretation was based on Banff criteria. In this study, the annual incidence of borderline rejection was found to be 9.2%. Diagnosis of early borderline rejection was settled in 14.9%, while 40 patients (85.1%) developed borderline rejection 1-year after transplant. Ninety-three patients experienced 1 attack of borderline rejection while 13 patients (12.3%) had frequent borderline rejection episodes.
In patients with borderline rejection, the mean age was 25.1 ± 10.3 years (range, 5-59 years), with male:female ratio, 2.2:1. All demographic and pretransplant data for all groups are outlined in Table 1. Patients aged 20 years or younger were less frequently in the borderline rejection group than the other groups (which was statistically significant) (P = .001).
Among the borderline rejection group, 102 patients (96.2%) received their first graft and 4 patients (3.8%) were retransplanted. Blood groups were different but compatible in 29 patients (27.35%). Nonspecific blood transfusion were given to 56 patients (52.8%) and 85.8% of patients had received their graft from related donors, whereas 15 patients (14.2%) were transplanted from emotionally related donors. Unrelated donors were more frequently in patients with acute rejection than other groups of patients (P = .001).
Table 1 shows that HLA/DR identical couples were found in 6.6% of patients (7/106) with borderline rejection, whereas 1 haplotype mismatch in 63.2% (67/106) of cases and 2 haplotype mismatch was found in 30.2% (32/106). HLA –A,-B and-DR mismatching were statistically significantly different (P = .003). Also the number of patients who received blood transfusions before transplant in acute rejection group compared with borderline rejection and borderline-free rejection episodes groups (P = .003).
Most patients in the borderline rejection group received triple immunosuppression therapy compared with the other groups (91.3%, 49.7%, 70.3% in borderline rejection, acute rejection, free rejection episodes groups, respectively). These differences were statistically significant (P = .001). The use of prophylactic induction antibody therapy was more evident in borderline rejection group than other groups (Table 2). The difference was also statistically significant (P = .001).
Treatment modalities for borderline rejection include pulse steroid therapy in 65.1% and increasing basal immunosuppressive therapy in 22.6%, whereas no treatment was used in 12.3% of patients. Using univariate and multivariate regression analysis of different variables on graft survival in borderline rejection patients revealed that none of them was statistically significant (Table 3).
Graft Survival
One-, 5-, and 10-year actuarial graft survival in borderline rejection, free
rejection episodes, and acute rejection groups were 100%, 95%, 90%; 78%, 83%,
70%; and 45%, 66%, 44%, respectively (Figure 1). These differences were
statistically significant (P = .0001). However, this statistically significant
difference was not evident when we compared borderline rejection versus acute
rejection groups (P = .32) or between borderline rejection and free rejection
episode groups at 20 years (P = .23).
Discussion
Renal allograft with borderline infiltrates have been studied in a variety of contexts. Studies using protocol biopsies of renal allografts suggest that borderline infiltrates have benign nature and may occur in patients with stable graft function (12). However, Rush and associates (13) have concluded that those borderline infiltrates may be injurious to allografts and the relation of these borderline infiltrates to episodes of earlier acute rejection or those changes are representing new rejection that necessitate antirejection therapy is not clear.
In the present study, borderline changes were found to occur in 47.1% of biopsies showing acute graft rejection. Graft biopsies were done owing to graft dysfunction and rejection suspicion. The reported incidence of borderline rejection was 2% in multicenter trials (3), 15% the work of Dooper and associates, 1995 (4), and 23% in another study (9). The target of these studies was to stratify patient responses to antirejection therapy and to detect the impact of energetic treatment versus no treatment on the graft outcome.
In our study, borderline rejection occurred in the first, 3 months after renal transplant in 24.5% of cases. Study of timing for the increased incidence of chronic rejection wits probably consequent graft loss (P < .01) when compared with no rejection group. So study of timing (early versus late borderline rejection ) may be of importance. This was concluded in recent literature (14) that reported that early acute rejection had increased incidence of chronic rejection and graft loss.
Also, in the work of Gulanikar and associates (16), the risk of graft loss was found to be related to the number of acute rejection episodes. In our work, borderline rejection occurred more than once in 12.3% and once in 87.9% of patients. It is noteworthy that 44.3% of patients with borderline rejection have not experienced more severe degrees of acute rejection on follow-up and most of the remainder has been exposed to predominately mild attacks (45.3%).
Borderline rejection has been shown to occur in younger age recipients (33% below the age of 20), and the parents are donors and of relatively older age (P < .003 compared with the no rejection group). The different immunologic parameters that may be involved in borderline rejection are also addressed in this work, as HLA and DR matching, which were found in several studies to have a role, in acute rejection and affect graft survival (17, 18). However, this association was denied by others (19, 20). Also, the different hematologic parameters such as blood groups, blood transfusion before kidney transplant also were found to have prognostic significance in some studies (21, 22). In our work, the finding of different blood groups was found to be significantly higher in borderline rejection group compared to nonrejection group (P < .001). However, pretransplant blood transfusion showed no statistical difference.
The impact of perioperative data including such as time to diuresis and acute tubular necrosis on the genesis of borderline rejection have shown a significant difference-compared with the other groups. However, the role of the above variables in acute rejection was found in previous studies (23, 24).
Change of basal immunosuppression or increase of steroid doses or use of steroid pulse therapy were undertaken in response to occurrence of biopsy-proven borderline infiltrates in graft biopsy with satisfactory response in 63.2% and marginal response in 36.8% of cases. Similar data were previously reported in the work of Saad and associates, 1997 (10) who found complete response to antirejection therapy in 75% of patients with borderline lesions and also in the work of Schweitzer and associates (5), who reported a response rate of 50% to antirejection therapy after exclusion of other causes of graft dysfunction.
In conclusion, borderline rejection is a frequent finding in biopsy-proven acute rejection after living-donor kidney transplant. Time of occurrence, frequency, presence of chronic changes, treatment or not and response to therapy were not predictors to graft survival. As with any retrospective study, the present results should be interpreted with caution.
References:
- Gray DW, Richardson A, Hughes D, et al. A prospective randomized, blind comparison of 3 biopsy techniques in the management of patients after renal transplantation. Transplantation. 1992;53:1226-1232.
- Racusen LC, Solez K, Coluin RB, Bonsib SM, Castro MC, Cavello T. The Banff 97 working classification of renal allograft pathology. Kidney Int. 1999;55 (2):713-723.
- Gaber LW, Moore LW, Gaber AO, et al. A multicenter report on the utilization of Banff grading in acute renal rejection. Transplant Proc. 1997;29:184-185.
- Dooper MM, Hoitsma AJ, Koene RAP, Bogman MJJT. Evaluation of the Banff criteria for histopathological diagnosis of rejection in renal allograft biopsies. Transplant Proc. 1995;27 (1):1005-1006.
- Schweitzer EJ, Drachenberg CB, Anderson L, et al. Significance of borderline biopsy. Am J Kidney Dis. 1996;28:585-588.
- Solez K, Hansen HE, Kornerup HJ, et al. Clinical validation and reproducibility of the Banff schema for renal allograft pathology. Transplant Proc. 1995;27 (1):1009-1011.
- Lorriaux C, Mac Gregor B, Dijoud F, et al. Should patients with borderline lesions of Banff criterai be treated by renal transplantation? Transplant Proc. 1998;30:2823-2824.
- Weiser J, Schreiber M, Budde K, et al. Prognostic values of the Banff classification. Transplant Int. 2000;13(1):S106-S111.
- MacDonald FI, Ashraf S, Picton M, et al. Banff criteria as predictor of outcome following acute renal allograft rejection. Nephrol Dial Transplant. 1999;14:1692-1697.
- Saad R, Gritsch HA, Shapiro R, et al. Clinical significance of renal allograft biopsies with "borderline changes" as defined in the Banff schema. Transplantation. 1997;64(7):992-995.
- Solez K, Benediktsson H, Carrollo T. Report of the third Banff conference on renal allograft pathology (July 20-24, 1995) on classification and lesion scoring in renal allograft pathology. Transplant Proc. 1996;28:441-444.
- Masin-Spasovska J, Spasovski G, Dzikova S, Petrusevska G, Popov Z. Do we have to treat subclinical rejections in early protocol renal allograft biopsies? Transplant Proc. 2007 Oct;39(8):2550-2553.
- Rush DN, Jeffrey JR, Gough J. Sequential protocol biopsies in renal transplant patients. Transplantation. 1995;59:511-524.
- Matoza JR, Danguilan RA, Chicano S. Impact of Banff borderline acute rejection among renal allograft recipients. Transplant Proc. 2008 Sep;40(7):2303-2306.
- Moreso F, Ibernon M, Gomà M, Carrera M, Fulladosa X. Subclinical rejection associated with chronic allograft nephropathy in protocol biopsies as a risk factor for late graft loss. Am J Transplant. 2006;6(4):747-752.
- Gulaniker AC, MacDonald AS, Sungertekin U. The incidence and impact of early rejection episodes on graft outcome in recipients of first cadaver kidney transplants. Transplantation 1992;53:323 -327.
- Hata Y, Ozawa M and Takemoto S. HLA matching. In: Clinical Transplants 1996, Terasaki, PI (Ed), UCLA Tissue Typing Laboratory, Los Angeles, 1997, p 381.
- Zafar N, Hafez S, Khan S, et al. Histocompatibility in live related donor renal transplantation. Transplant Proc. 1997;29 (7):2973.
- Shajeen FAM, AlSulaiman M. Mousa D, et al. Impact of donor/recipient gender age HLA matching and weight on short-term graft survival following living related renal transplantation. Transplant Proc. 1998;30 (7):3655.
- Klein T, Shapira Z, bar Nathan N, et al. Lack of correlation between HLA match and long-term survival in living-donor kidney transplantation. Transplant Proc. 2000;32(4):692.
- Park K, Kim YS, Kim MS. A 16-year experience with 1275 primary living donor kidney transplants: Univariate and multivariate analysis of risk factors affecting graft survival. Transplant Proc. 1996;28:1578.
- Opelz G, VanRenterghem Y, Kirste G. Prospective evaluation of pretransplant blood transfusion in cadaver kidney recipients. Transplantation. 1997;63:964-969.
- Benedetti E, Troppmann C, Gillingham K. Short and long-term outcomes of kidney transplants with multiple renal arteries. Ann Surg. 1995;221:406-410.
- Bugge JF, Hartmann A, Osnes S. Immediate and early renal function after living donor transplantation. Nephrol Dial Transplant. 1999;14:389-394.
Volume : 7
Issue : 4
Pages : 228 - 232
From the Urology and Nephrology Center, University of Mansoura, Mansoura, Egypt
Address reprint requests to: Amgad E. El-Agroudy, MD, Urology & Nephrology
Center, Mansoura University, Mansoura, Egypt.
Phone: +2 050 2262222
Fax: +2 050 2263717
E-mail:
amgadelagroudy@hotmail.com
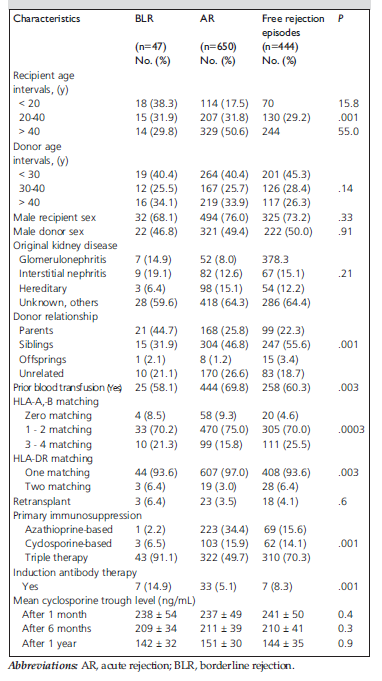
Table 1. Demographic characteristics of borderline rejection, acute rejection and rejection free groups.
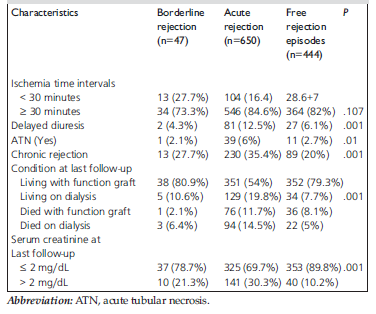
Table 2. Perioperative and postoperative variables in borderline rejection, acute rejection, and free rejection groups.
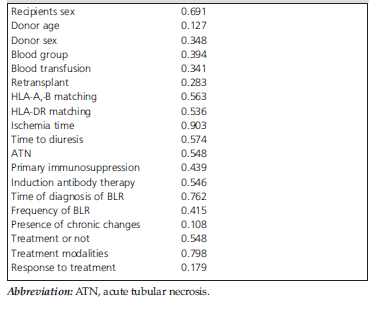
Table 3. Univariate analysis of risk factors affecting graft survival in patients with borderline rejection.
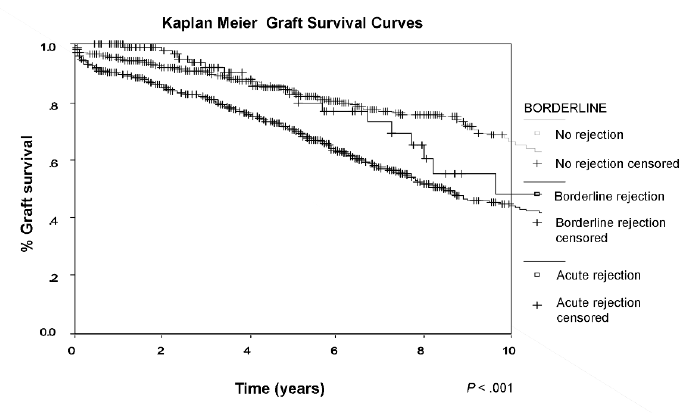
Figure 1. Actuarial graft survival for borderline rejection, no rejection, and acute rejection groups